Cablevision 2011 Annual Report Download - page 80
Download and view the complete annual report
Please find page 80 of the 2011 Cablevision annual report below. You can navigate through the pages in the report by either clicking on the pages listed below, or by using the keyword search tool below to find specific information within the annual report.-
 1
1 -
2
-
3
-
4
-
5
-
6
-
7
-
8
-
9
-
10
-
11
-
12
-
13
-
14
-
15
-
16
-
17
-
18
-
19
-
20
-
21
-
22
-
23
-
24
-
25
-
26
-
27
-
28
-
29
-
30
-
31
-
32
-
33
-
34
-
35
-
36
-
37
-
38
-
39
-
40
-
41
-
42
-
43
-
44
-
45
-
46
-
47
-
48
-
49
-
50
-
51
-
52
-
53
-
54
-
55
-
56
-
57
-
58
-
59
-
60
-
61
-
62
-
63
-
64
-
65
-
66
-
67
-
68
-
69
-
 70
70 -
 71
71 -
 72
72 -
 73
73 -
 74
74 -
 75
75 -
 76
76 -
 77
77 -
 78
78 -
 79
79 -
 80
80 -
 81
81 -
 82
82 -
 83
83 -
 84
84 -
 85
85 -
 86
86 -
 87
87 -
 88
88 -
 89
89 -
 90
90 -
91
-
92
-
93
-
94
-
95
-
96
-
97
-
98
-
99
-
100
-
101
-
102
-
103
-
104
-
105
-
106
-
107
-
108
-
109
-
110
-
111
-
112
-
113
-
114
-
115
-
116
-
117
-
118
-
119
-
120
-
121
-
122
-
123
-
124
-
125
-
126
-
127
-
128
-
129
-
130
-
131
-
132
-
133
-
134
-
135
-
136
-
137
-
138
-
139
-
140
-
141
-
142
-
143
-
144
-
145
-
146
-
147
-
148
-
149
-
150
-
151
-
152
-
153
-
154
-
155
-
156
-
157
-
158
-
159
-
160
-
161
-
162
-
163
-
164
-
165
-
166
-
167
-
168
-
169
-
170
-
171
-
172
-
173
-
174
-
175
-
176
-
177
-
178
-
179
-
180
-
181
-
182
-
183
-
184
-
185
-
186
-
187
-
188
-
189
-
190
-
191
-
192
-
193
-
194
-
195
-
196
-
197
-
198
-
199
-
200
-
201
-
202
-
203
-
204
-
205
-
206
-
207
-
208
-
209
-
210
-
211
-
212
-
213
-
214
-
215
-
216
-
217
-
218
-
219
-
220
 |
 |
(74)
Net cash provided by operating activities of discontinued operations amounted to $390,732 for the year
ended December 31, 2009. The 2009 cash provided by operating activities resulted primarily from
income of $329,307 before depreciation and amortization, non-cash items of $361,687 and an increase in
accounts payable and other liabilities of $29,191. Partially offsetting these increases were decreases in
cash of $258,695 resulting from the acquisition of and payment of obligations relating to program rights
and an increase in current and other assets of $70,758.
Net Cash Used in Investing Activities
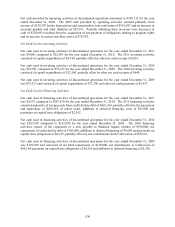
Net cash used in investing activities of discontinued operations for the year ended December 31, 2011
was $4,086 compared to $22,591 for the year ended December 31, 2010. The 2011 investing activities
consisted of capital expenditures of $4,340, partially offset by other net cash receipts of $254.
Net cash used in investing activities of discontinued operations for the year ended December 31, 2010
was $22,591 compared to $75,237 for the year ended December 31, 2009. The 2010 investing activities
consisted of capital expenditures of $23,240, partially offset by other net cash receipts of $649.
Net cash used in investing activities of discontinued operations for the year ended December 31, 2009
was $75,237 and consisted of capital expenditures of $72,780 and other net cash payments of $2,457.
Net Cash Used in Financing Activities
Net cash used in financing activities of discontinued operations for the year ended December 31, 2011
was $2,857 compared to $207,670 for the year ended December 31, 2010. The 2011 financing activities
consisted primarily of net proceeds from credit facility debt of $667,364, partially offset by the repayment
and repurchase of $638,365 of senior notes, additions to deferred financing costs of $23,900 and
payments on capital lease obligations of $2,242.
Net cash used in financing activities of discontinued operations for the year ended December 31, 2010
was $207,670 compared to $192,890 for the year ended December 31, 2009. The 2010 financing
activities consist of the repayment of a note payable to Madison Square Garden of $190,000, net
repayments of credit facility debt of $105,000, additions to deferred financing of $8,069 and payments on
capital lease obligations of $4,215, partially offset by net contributions from Cablevision of $99,614.
Net cash used in financing activities of discontinued operations for the year ended December 31, 2009
was $192,890 and consisted of net bank repayments of $120,000, net distributions to Cablevision of
$66,104, payments on capital lease obligations of $4,256 and additions to deferred financing of $2,530.