Cablevision 2011 Annual Report Download - page 160
Download and view the complete annual report
Please find page 160 of the 2011 Cablevision annual report below. You can navigate through the pages in the report by either clicking on the pages listed below, or by using the keyword search tool below to find specific information within the annual report.-
 1
1 -
2
-
3
-
4
-
5
-
6
-
7
-
8
-
9
-
10
-
11
-
12
-
13
-
14
-
15
-
16
-
17
-
18
-
19
-
20
-
21
-
22
-
23
-
24
-
25
-
26
-
27
-
28
-
29
-
30
-
31
-
32
-
33
-
34
-
35
-
36
-
37
-
38
-
39
-
40
-
41
-
42
-
43
-
44
-
45
-
46
-
47
-
48
-
49
-
50
-
51
-
52
-
53
-
54
-
55
-
56
-
57
-
58
-
59
-
60
-
61
-
62
-
63
-
64
-
65
-
66
-
67
-
68
-
69
-
70
-
71
-
72
-
73
-
74
-
75
-
76
-
77
-
78
-
79
-
80
-
81
-
82
-
83
-
84
-
85
-
86
-
87
-
88
-
89
-
90
-
91
-
92
-
93
-
94
-
95
-
96
-
97
-
98
-
99
-
100
-
101
-
102
-
103
-
104
-
105
-
106
-
107
-
108
-
109
-
110
-
111
-
112
-
113
-
114
-
115
-
116
-
117
-
118
-
119
-
120
-
121
-
122
-
123
-
124
-
125
-
126
-
127
-
128
-
129
-
130
-
131
-
132
-
133
-
134
-
135
-
136
-
137
-
138
-
139
-
140
-
141
-
142
-
143
-
144
-
145
-
146
-
147
-
148
-
149
-
 150
150 -
 151
151 -
 152
152 -
 153
153 -
 154
154 -
 155
155 -
 156
156 -
 157
157 -
 158
158 -
 159
159 -
 160
160 -
 161
161 -
 162
162 -
 163
163 -
 164
164 -
 165
165 -
 166
166 -
 167
167 -
 168
168 -
 169
169 -
 170
170 -
171
-
172
-
173
-
174
-
175
-
176
-
177
-
178
-
179
-
180
-
181
-
182
-
183
-
184
-
185
-
186
-
187
-
188
-
189
-
190
-
191
-
192
-
193
-
194
-
195
-
196
-
197
-
198
-
199
-
200
-
201
-
202
-
203
-
204
-
205
-
206
-
207
-
208
-
209
-
210
-
211
-
212
-
213
-
214
-
215
-
216
-
217
-
218
-
219
-
220
 |
 |

COMBINED NOTES TO CONSOLIDATED FINANCIAL STATEMENTS (continued)
(Dollars in thousands, except per share amounts)
I-36
comparable public companies taking into consideration synergies a market participant may generate. The
market approach requires significant judgments determining comparable market multiples. The estimated
fair values of the Newsday business indefinite-lived intangibles, which relate primarily to the trademarks
associated with its mastheads, were based on discounted future cash flows calculated utilizing the relief-
from-royalty method. Changes in such estimates or the application of alternative assumptions could
produce significantly different results.
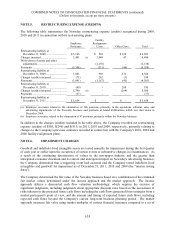
The Company's impairment analysis as of December 31, 2011, 2010 and 2009 resulted in pre-tax
impairment charges of $11,000, $7,800 and $2,000, respectively, related to the excess of the carrying
value over the estimated fair value of certain indefinite-lived intangibles. These pre-tax impairment
charges are included in depreciation and amortization (including impairments) in the Other segment. No
goodwill impairment was recorded for the years ended December 31, 2011, 2010 and 2009.
In addition, the Company recorded impairment charges of $2,506, $1,803 and $1,436 in 2011, 2010 and
2009, respectively, included in depreciation and amortization. These charges relate primarily to certain
other long-lived assets related to the Company's theatre operations and the Newsday business in the Other
segment.
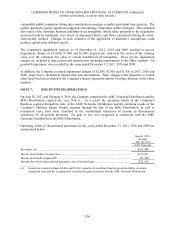
NOTE 7. DISCONTINUED OPERATIONS
On June 30, 2011 and February 9, 2010, the Company completed the AMC Networks Distribution and the
MSG Distribution, respectively, (see Note 1). As a result, the operating results of the Company's
Rainbow segment through the date of the AMC Networks Distribution and the operating results of the
Company's Madison Square Garden segment through the date of the MSG Distribution, as well as
transaction costs, have been classified in the consolidated statements of income as discontinued
operations for all periods presented. No gain or loss was recognized in connection with the AMC
Networks Distribution or the MSG Distribution.
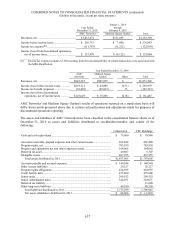
Operating results of discontinued operations for the years ended December 31, 2011, 2010 and 2009 are
summarized below:
January 1,2011
through
June 30, 2011
AMC Networks
Revenues, net .................................................................................................................................. $551,480
Income (loss) before income taxes .................................................................................................. $115,015
Income tax benefit (expense)(a) ...................................................................................................... (61,392)
Income (loss) from discontinued operations, net of income taxes .................................................. $ 53,623
_____________
(a) Income tax expense includes $6,406 and $3,969, respectively, resulting from the non-deductibility of certain
transaction costs and the recognition of a deferred tax gain associated with the AMC Networks Distribution.