Berkshire Hathaway 2006 Annual Report Download - page 72
Download and view the complete annual report
Please find page 72 of the 2006 Berkshire Hathaway annual report below. You can navigate through the pages in the report by either clicking on the pages listed below, or by using the keyword search tool below to find specific information within the annual report.-
 1
1 -
2
-
3
-
4
-
5
-
6
-
7
-
8
-
9
-
10
-
11
-
12
-
13
-
14
-
15
-
16
-
17
-
18
-
19
-
20
-
21
-
22
-
23
-
24
-
25
-
26
-
27
-
28
-
29
-
30
-
31
-
32
-
33
-
34
-
35
-
36
-
37
-
38
-
39
-
40
-
41
-
42
-
43
-
44
-
45
-
46
-
47
-
48
-
49
-
50
-
51
-
52
-
53
-
54
-
55
-
56
-
57
-
58
-
59
-
60
-
61
-
 62
62 -
 63
63 -
 64
64 -
 65
65 -
 66
66 -
 67
67 -
 68
68 -
 69
69 -
 70
70 -
 71
71 -
 72
72 -
 73
73 -
 74
74 -
 75
75 -
 76
76 -
 77
77 -
 78
78 -
 79
79 -
 80
80 -
 81
81 -
 82
82
 |
 |

71
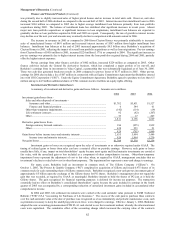
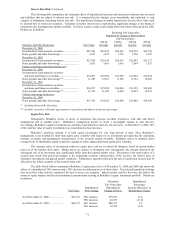
Interest Rate Risk (Continued)
The following table summarizes the estimated effects of hypothetical increases and decreases in interest rates on assets
and liabilities that are subject to interest rate risk. It is assumed that the changes occur immediately and uniformly to each
category of instrument containing interest rate risk. The hypothetical changes in market interest rates do not reflect what could
be deemed best or worst case scenarios. Variations in market interest rates could produce significant changes in the timing of
repayments due to prepayment options available. For these reasons, actual results might differ from those reflected in the table.
Dollars are in millions.
Estimated Fair Value after
Hypothetical Change in Interest Rates
(bp=basis points)
100 bp 100 bp 200 bp 300 bp
Insurance and other businesses Fair Value decrease increase increase increase
December 31, 2006
Investments in fixed maturity securities........................ $25,300 $25,939 $24,663 $24,079 $23,558
Notes payable and other borrowings ............................. 3,815 3,872 3,765 3,720 3,679
December 31, 2005
Investments in fixed maturity securities........................ $27,420 $28,199 $26,655 $25,942 $25,327
Notes payable and other borrowings ............................. 3,653 3,693 3,616 3,584 3,553
Finance and financial products businesses *
December 31, 2006
Investments in fixed maturity securities
and loans and finance receivables.............................. $14,987 $15,994 $13,986 $13,062 $12,224
Notes payable and other borrowings ** ........................ 11,949 12,363 11,525 11,152 10,805
December 31, 2005
Investments in fixed maturity securities
and loans and finance receivables.............................. $14,817 $15,508 $14,068 $13,358 $12,699
Notes payable and other borrowings ** ........................ 11,476 11,902 11,004 10,607 10,239
Utilities and energy businesses
December 31, 2006
Notes payable and other borrowings ............................. $17,789 $19,256 $16,548 $15,486 $14,569
* Excludes General Re Securities.
** Includes securities sold under agreements to repurchase and effects of interest rate swaps.
Equity Price Risk
Strategically, Berkshire strives to invest in businesses that possess excellent economics, with able and honest
management and at sensible prices. Berkshire’s management prefers to invest a meaningful amount in each investee.
Accordingly, Berkshire’s equity investments are generally concentrated in relatively few investees. At December 31, 2006, 54%
of the total fair value of equity investments was concentrated in four investees.
Berkshire’s preferred strategy is to hold equity investments for very long periods of time. Thus, Berkshire’s
management is not troubled by short-term equity price volatility with respect to its investments provided that the underlying
business, economic and management characteristics of the investees remain favorable. Berkshire strives to maintain above
average levels of shareholder capital to provide a margin of safety against short-term equity price volatility.
The carrying values of investments subject to equity price risk are, in almost all instances, based on quoted market
prices as of the balance sheet dates. Market prices are subject to fluctuation and, consequently, the amount realized in the
subsequent sale of an investment may significantly differ from the reported market value. Fluctuation in the market price of a
security may result from perceived changes in the underlying economic characteristics of the investee, the relative price of
alternative investments and general market conditions. Furthermore, amounts realized in the sale of a particular security may be
affected by the relative quantity of the security being sold.
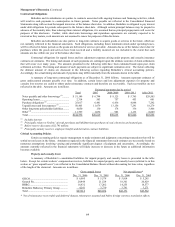
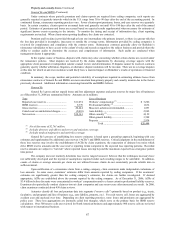
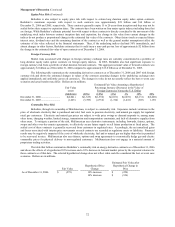
The table which follows summarizes Berkshire’s equity price risk as of December 31, 2006 and 2005 and shows the
effects of a hypothetical 30% increase and a 30% decrease in market prices as of those dates. The selected hypothetical change
does not reflect what could be considered the best or worst case scenarios. Indeed, results could be far worse due both to the
nature of equity markets and the aforementioned concentrations existing in Berkshire’s equity investment portfolio. Dollars are
in millions.
Estimated Hypothetical
Fair Value after Percentage
Hypothetical Hypothetical Increase (Decrease) in
Fair Value Price Change Change in Prices Shareholders’ Equity
As of December 31, 2006....................... $61,533 30% increase $79,993 11.0
30% decrease 43,073 (11.0)
As of December 31, 2005....................... $46,721 30% increase $60,737 9.9
30% decrease 32,705 (9.9)