Berkshire Hathaway 2006 Annual Report Download - page 48
Download and view the complete annual report
Please find page 48 of the 2006 Berkshire Hathaway annual report below. You can navigate through the pages in the report by either clicking on the pages listed below, or by using the keyword search tool below to find specific information within the annual report.-
 1
1 -
2
-
3
-
4
-
5
-
6
-
7
-
8
-
9
-
10
-
11
-
12
-
13
-
14
-
15
-
16
-
17
-
18
-
19
-
20
-
21
-
22
-
23
-
24
-
25
-
26
-
27
-
28
-
29
-
30
-
31
-
32
-
33
-
34
-
35
-
36
-
37
-
 38
38 -
 39
39 -
 40
40 -
 41
41 -
 42
42 -
 43
43 -
 44
44 -
 45
45 -
 46
46 -
 47
47 -
 48
48 -
 49
49 -
 50
50 -
 51
51 -
 52
52 -
 53
53 -
 54
54 -
 55
55 -
 56
56 -
 57
57 -
 58
58 -
59
-
60
-
61
-
62
-
63
-
64
-
65
-
66
-
67
-
68
-
69
-
70
-
71
-
72
-
73
-
74
-
75
-
76
-
77
-
78
-
79
-
80
-
81
-
82
 |
 |

47
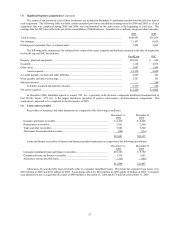
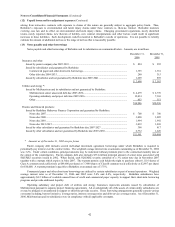
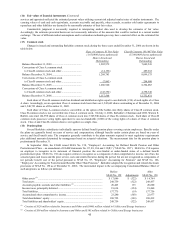
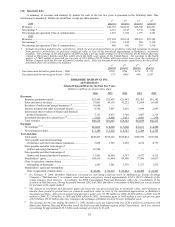
(18) Pension plans (Continued)
Benefit payments over the next ten years, which reflect expected future service as appropriate, are expected to be paid as
follows (in millions): 2007 - $390; 2008 - $399; 2009 - $411; 2010 - $414; 2011 - $432; and 2012 to 2016 - $2,456.
Weighted average interest rate assumptions used in determining projected benefit obligations were as follows. These rates are
substantially the same as the weighted average rates used in determining the net periodic pension expense.
2006 2005
Discount rate ....................................................................................................................................................... 5.7 5.7
Expected long-term rate of return on plan assets................................................................................................. 6.9 6.4
Rate of compensation increase ............................................................................................................................ 4.4 4.4
Many Berkshire subsidiaries sponsor defined contribution retirement plans, such as 401(k) or profit sharing plans. Employee
contributions to the plans are subject to regulatory limitations and the specific plan provisions. Berkshire subsidiaries may match
these contributions up to levels specified in the plans, and may make additional discretionary contributions as determined by
management. The total expenses related to employer contributions for these plans were $498 million, $395 million and $338 million
for the years ended December 31, 2006, 2005 and 2004, respectively.
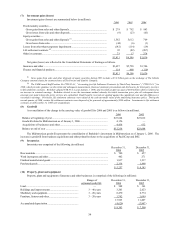
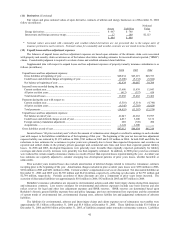
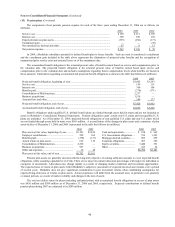
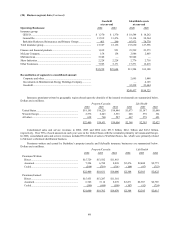
(19) Supplemental cash flow information
A summary of supplemental cash flow information for each of the three years ending December 31, 2006 is presented in the
following table (in millions).
2006 2005 2004
Cash paid during the year for:
Income taxes............................................................................................................................. $4,959 $2,695 $2,674
Interest of finance and financial products businesses................................................................ 514 484 495
Interest of utilities and energy businesses................................................................................. 937 — —
Interest of insurance and other businesses ................................................................................ 195 149 146
Non-cash investing and financing activities:
Liabilities assumed in connection with acquisitions of businesses ........................................... 12,727 2,163 72
Fixed maturity securities sold offset by decrease in directly related repurchase
agreements ......................................................................................................................... 460 4,693 2,075
Value of equity securities and warrants exchanged for equity securities .................................. — 5,877 585
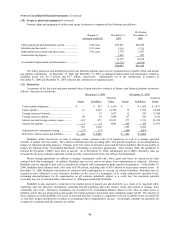
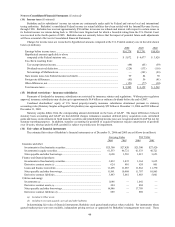
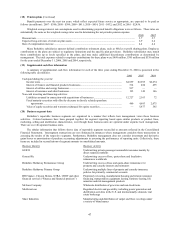
(20) Business segment data
Berkshire’ s reportable business segments are organized in a manner that reflects how management views those business
activities. Certain businesses have been grouped together for segment reporting based upon similar products or product lines,
marketing, selling and distribution characteristics, even though those business units are operated under separate local management.
There are over 40 separate business units.
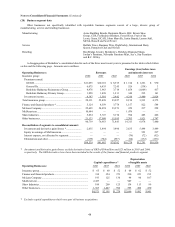
The tabular information that follows shows data of reportable segments reconciled to amounts reflected in the Consolidated
Financial Statements. Intersegment transactions are not eliminated in instances where management considers those transactions in
assessing the results of the respective segments. Furthermore, Berkshire management does not consider investment and derivative
gains/losses or amortization of purchase accounting adjustments in assessing the performance of reporting units. Collectively, these
items are included in reconciliations of segment amounts to consolidated amounts.
Business Identity Business Activity
GEICO Underwriting private passenger automobile insurance mainly by
direct response methods
General Re Underwriting excess-of-loss, quota-share and facultative
reinsurance worldwide
Berkshire Hathaway Reinsurance Group Underwriting excess-of-loss and quota-share reinsurance for
property and casualty insurers and reinsurers
Berkshire Hathaway Primary Group Underwriting multiple lines of property and casualty insurance
policies for primarily commercial accounts
BH Finance, Clayton Homes, XTRA, CORT and other
financial services (“Finance and financial products”)
Proprietary investing, manufactured housing and related consumer
financing, transportation equipment leasing, furniture leasing, life
annuities and risk management products
McLane Company Wholesale distribution of groceries and non-food items
MidAmerican Regulated electric and gas utility, including power generation and
distribution activities in the U.S. and internationally; domestic real
estate brokerage
Shaw Industries Manufacturing and distribution of carpet and floor coverings under
a variety of brand names