Berkshire Hathaway 2006 Annual Report Download - page 50
Download and view the complete annual report
Please find page 50 of the 2006 Berkshire Hathaway annual report below. You can navigate through the pages in the report by either clicking on the pages listed below, or by using the keyword search tool below to find specific information within the annual report.-
 1
1 -
2
-
3
-
4
-
5
-
6
-
7
-
8
-
9
-
10
-
11
-
12
-
13
-
14
-
15
-
16
-
17
-
18
-
19
-
20
-
21
-
22
-
23
-
24
-
25
-
26
-
27
-
28
-
29
-
30
-
31
-
32
-
33
-
34
-
35
-
36
-
37
-
38
-
39
-
 40
40 -
 41
41 -
 42
42 -
 43
43 -
 44
44 -
 45
45 -
 46
46 -
 47
47 -
 48
48 -
 49
49 -
 50
50 -
 51
51 -
 52
52 -
 53
53 -
 54
54 -
 55
55 -
 56
56 -
 57
57 -
 58
58 -
 59
59 -
 60
60 -
61
-
62
-
63
-
64
-
65
-
66
-
67
-
68
-
69
-
70
-
71
-
72
-
73
-
74
-
75
-
76
-
77
-
78
-
79
-
80
-
81
-
82
 |
 |

49
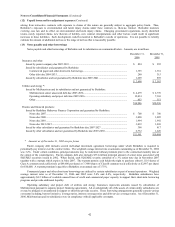
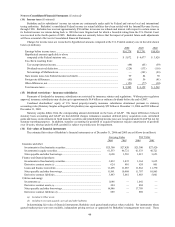
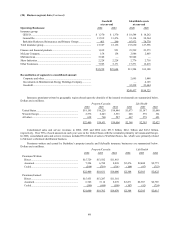
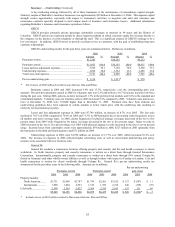
(20) Business segment data (Continued)
Goodwill Identifiable assets
at year-end at year-end
Operating Businesses: 2006 2005 2006 2005
Insurance group:
GEICO............................................................................................. $ 1,370 $ 1,370 $ 18,544 $ 18,262
General Re....................................................................................... 13,532 13,476 31,114 30,564
Berkshire Hathaway Reinsurance and Primary Groups................... 465 290 85,972 78,770
Total insurance group ......................................................................... 15,367 15,136 135,630 127,596
Finance and financial products ........................................................... 1,012 951 23,599 23,573
McLane Company .............................................................................. 158 158 2,986 2,803
MidAmerican...................................................................................... 5,548 — 30,942 —
Shaw Industries................................................................................... 2,228 2,228 2,776 2,718
Other businesses ................................................................................. 7,925 5,171 17,571 12,418
$32,238 $23,644 213,504 169,108
Reconciliation of segments to consolidated amount:
Corporate and other ........................................................................ 2,695 1,448
Investments in MidAmerican Energy Holdings Company.............. — 4,125
Goodwill ......................................................................................... 32,238 23,644
$248,437 $198,325
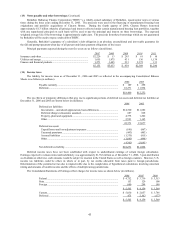
Insurance premiums written by geographic region (based upon the domicile of the insured or reinsured) are summarized below.
Dollars are in millions.
Property/Casualty Life/Health
2006 2005 2004 2006 2005 2004
United States ................................................................ $19,195 $16,228 $14,886 $1,073 $1,147 $1,040
Western Europe............................................................ 2,576 2,643 3,533 628 578 361
All other ....................................................................... 638 760 587 667 578 621
$22,409 $19,631 $19,006 $2,368 $2,303 $2,022
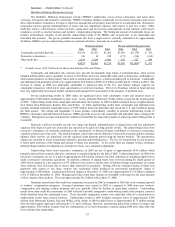
Consolidated sales and service revenues in 2006, 2005 and 2004 were $51.8 billion, $46.1 billion and $43.2 billion,
respectively. Over 90% of such amounts in each year were in the United States with the remainder primarily in Canada and Europe.
In 2006, consolidated sales and service revenues included $9.6 billion of sales to Wal-Mart Stores, Inc. which were primarily related
to McLane’ s wholesale distribution business.
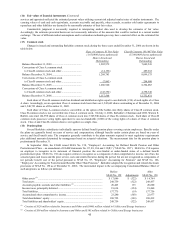
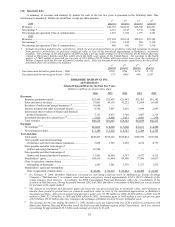
Premiums written and earned by Berkshire’ s property/casualty and life/health insurance businesses are summarized below.
Dollars are in millions.
Property/Casualty Life/Health
2006 2005 2004 2006 2005 2004
Premiums Written:
Direct ........................................................................ $15,729 $13,582 $11,483
Assumed ................................................................... 7,224 6,788 8,039 $2,476 $2,400 $2,775
Ceded ........................................................................ (544) (739) (516) (108) (97) (753)
$22,409 $19,631 $19,006 $2,368 $2,303 $2,022
Premiums Earned:
Direct ........................................................................ $15,453 $13,287 $11,301
Assumed ................................................................... 6,746 7,114 8,278 $2,471 $2,387 $2,769
Ceded ........................................................................ (599) (699) (509) (107) (92) (754)
$21,600 $19,702 $19,070 $2,364 $2,295 $2,015