Berkshire Hathaway 2006 Annual Report Download - page 54
Download and view the complete annual report
Please find page 54 of the 2006 Berkshire Hathaway annual report below. You can navigate through the pages in the report by either clicking on the pages listed below, or by using the keyword search tool below to find specific information within the annual report.-
 1
1 -
2
-
3
-
4
-
5
-
6
-
7
-
8
-
9
-
10
-
11
-
12
-
13
-
14
-
15
-
16
-
17
-
18
-
19
-
20
-
21
-
22
-
23
-
24
-
25
-
26
-
27
-
28
-
29
-
30
-
31
-
32
-
33
-
34
-
35
-
36
-
37
-
38
-
39
-
40
-
41
-
42
-
43
-
 44
44 -
 45
45 -
 46
46 -
 47
47 -
 48
48 -
 49
49 -
 50
50 -
 51
51 -
 52
52 -
 53
53 -
 54
54 -
 55
55 -
 56
56 -
 57
57 -
 58
58 -
 59
59 -
 60
60 -
 61
61 -
 62
62 -
 63
63 -
 64
64 -
65
-
66
-
67
-
68
-
69
-
70
-
71
-
72
-
73
-
74
-
75
-
76
-
77
-
78
-
79
-
80
-
81
-
82
 |
 |

53
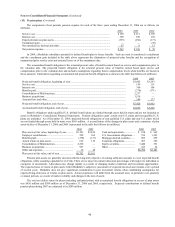
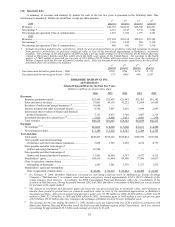
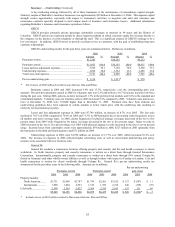
(22) Quarterly data
A summary of revenues and earnings by quarter for each of the last two years is presented in the following table. This
information is unaudited. Dollars are in millions, except per share amounts.
1
s
t2nd 3rd 4th
2006 Quarter Quarter Quarter Quarter
Revenues.............................................................................................................. $22,763 $24,185 $25,360 $26,231
N
et earnings *...................................................................................................... 2,313 2,347 2,772 3,583
N
et earnings per equivalent Class A common share............................................ 1,501 1,522 1,797 2,323
2005
Revenues.............................................................................................................. $17,634 $18,128 $20,533 $25,368
N
et earnings *...................................................................................................... 1,363 1,449 586 5,130
N
et earnings per equivalent Class A common share............................................ 886 941 381 3,330
* Includes investment and derivative gains/losses, which, for any given period have no predictive value and variations in amount
from period to period have no practical analytical value in view of the unrealized appreciation in Berkshire’s investment
portfolio. Net earnings in the third quarter of 2005 include a pre-tax underwriting loss of $3.0 billion ($1.95 billion after-tax)
related to Hurricanes Katrina and Rita which struck the Gulf coast region of the United States. Net earnings in the fourth
quarter of 2005 include a non-cash pre-tax gain of $5.0 billion ($3.25 billion after-tax) which arose from the exchange of
Gillette common stock for Procter & Gamble common stock. After-tax investment and derivative gains/losses for the periods
presented above are as follows (in millions):
1
s
t
2
nd
3
rd
4
th
Quarter Quarter Quarter Quarter
I
nvestment and derivative gains/losses – 2006 ................................................... $526 $294 $174 $ 715
I
nvestment and derivative gains/losses – 2005 ................................................... (77) (160) 480 3,287
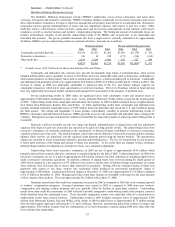
BERKSHIRE HATHAWAY INC.
and Subsidiaries
Selected Financial Data for the Past Five Years
(dollars in millions except per share data)
2006 2005 2004 2003 2002
Revenues:
Insurance premiums earned.................................................... $23,964 $21,997 $21,085 $21,493 $19,182
Sales and service revenues ..................................................... 51,803 46,138 43,222 32,098 16,958
Revenues of utilities and energy businesses (1) ....................... 10,644 — — — —
Interest, dividend and other investment income ..................... 4,382 3,487 2,816 3,098 2,943
Interest and other revenues of finance and financial
products businesses .............................................................
5,111
4,633
3,788
3,087
2,314
Investment and derivative gains/losses (2)............................... 2,635 5,408 3,471 4,083 838
Total revenues ........................................................................ $98,539 $81,663 $74,382 $63,859 $42,235
Earnings:
Net earnings (2) (3).................................................................... $11,015 $ 8,528 $ 7,308 $ 8,151 $ 4,286
Net earnings per share ............................................................ $ 7,144 $ 5,538 $ 4,753 $ 5,309 $ 2,795
Year-end data:
Total assets ............................................................................. $248,437 $198,325 $188,874 $180,559 $169,544
Notes payable and other borrowings
of insurance and other non-finance businesses.................... 3,698 3,583 3,450 4,182 4,775
Notes payable and other borrowings of
utilities and energy businesses (1) ........................................ 16,946 — — — —
Notes payable and other borrowings of
finance and financial products businesses........................... 11,961 10,868 5,387 4,937 4,513
Shareholders’ equity............................................................... 108,419 91,484 85,900 77,596 64,037
Class A equivalent common shares
outstanding, in thousands .................................................... 1,543 1,541 1,539 1,537 1,535
Shareholders’ equity per outstanding
Class A equivalent common share ...................................... $ 70,281 $ 59,377 $ 55,824 $ 50,498 $ 41,727
(1) On February 9, 2006, Berkshire Hathaway converted its non-voting preferred stock of MidAmerican Energy Holdings
Company (“MidAmerican”) to common stock and upon conversion, owned approximately 83.4% (80.5% diluted) of the
voting common stock interests. Accordingly, the 2006 Consolidated Financial Statements reflect the consolidation of the
accounts of MidAmerican. During the period between 2002 and 2005, Berkshire’s investment in MidAmerican was accounted
for pursuant to the equity method.
(2) The amount of investment and derivative gains and losses for any given period has no predictive value, and variations in
amount from period to period have no practical analytical value in view of the unrealized appreciation in Berkshire's
investment portfolio. After-tax investment and derivative gains were $1,709 million in 2006, $3,530 million in 2005, $2,259
million in 2004, $2,729 million in 2003 and $566 million in 2002. Investment gains in 2005 include a non-cash pre-tax gain
of $5.0 billion ($3.25 billion after-tax) relating to the exchange of Gillette stock for Procter & Gamble stock.
(3) Net earnings for the year ending December 31, 2005 includes a pre-tax underwriting loss of $3.4 billion in connection with
Hurricanes Katrina, Rita and Wilma that struck the Gulf coast and Southeast regions of the United States. Such loss reduced
net earnings by approximately $2.2 billion and earnings per share by $1,446.