Berkshire Hathaway 2006 Annual Report Download - page 16
Download and view the complete annual report
Please find page 16 of the 2006 Berkshire Hathaway annual report below. You can navigate through the pages in the report by either clicking on the pages listed below, or by using the keyword search tool below to find specific information within the annual report.-
 1
1 -
2
-
3
-
4
-
5
-
 6
6 -
 7
7 -
 8
8 -
 9
9 -
 10
10 -
 11
11 -
 12
12 -
 13
13 -
 14
14 -
 15
15 -
 16
16 -
 17
17 -
 18
18 -
 19
19 -
 20
20 -
 21
21 -
 22
22 -
 23
23 -
 24
24 -
 25
25 -
 26
26 -
27
-
28
-
29
-
30
-
31
-
32
-
33
-
34
-
35
-
36
-
37
-
38
-
39
-
40
-
41
-
42
-
43
-
44
-
45
-
46
-
47
-
48
-
49
-
50
-
51
-
52
-
53
-
54
-
55
-
56
-
57
-
58
-
59
-
60
-
61
-
62
-
63
-
64
-
65
-
66
-
67
-
68
-
69
-
70
-
71
-
72
-
73
-
74
-
75
-
76
-
77
-
78
-
79
-
80
-
81
-
82
 |
 |

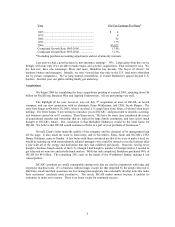
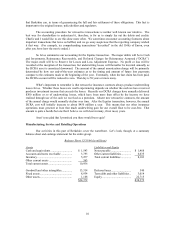
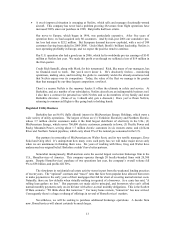
Here’ s a breakdown of earnings in this sector: (in millions)
Pre-Tax Earnings Interest-Bearing Liabilities
2006 2005 2006 2005
Trading – ordinary income ............................ $ 274 $ 200 $ 600 $1,061
Gen Re Securities (loss) ................................. (5) (104) 1,204* 2,617*
Life and annuity operation ............................. 29 11 2,459 2,461
Value Capital (loss) ....................................... 6 (33) N/A N/A
Leasing operations ......................................... 182 173 261 370
Manufactured-housing finance (Clayton)....... 513 416 10,498 9,299
Other............................................................... 158 159 N/A N/A
Income before capital gains............................ 1,157 822
Trading – capital gains (losses) ..................... 938 (234)
Total .............................................................. $ 2,095 $ 588
*Includes all liabilities
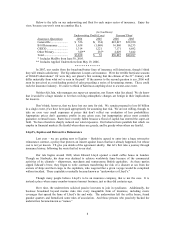
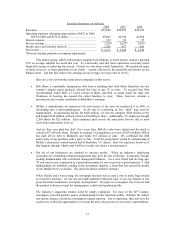
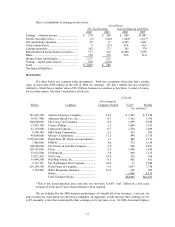
Investments
We show below our common stock investments. With two exceptions, those that had a market
value of more than $700 million at the end of 2006 are itemized. We don’ t itemize the two securities
referred to, which have a market value of $1.9 billion, because we continue to buy them. I could, of course,
tell you their names. But then I would have to kill you.
12/31/06
Percentage of
Shares Company Company Owned Cost* Market
(in millions)
151,610,700 American Express Company ................... 12.6 $ 1,287 $ 9,198
36,417,400 Anheuser-Busch Cos., Inc. ...................... 4.7 1,761 1,792
200,000,000 The Coca-Cola Company ........................ 8.6 1,299 9,650
17,938,100 Conoco Phillips ....................................... 1.1 1,066 1,291
21,334,900 Johnson & Johnson.................................. 0.7 1,250 1,409
6,708,760 M&T Bank Corporation .......................... 6.1 103 820
48,000,000 Moody’ s Corporation .............................. 17.2 499 3,315
2,338,961,000 PetroChina “H” shares (or equivalents)... 1.3 488 3,313
3,486,006 POSCO.................................................... 4.0 572 1,158
100,000,000 The Procter & Gamble Company ............ 3.2 940 6,427
229,707,000 Tesco ....................................................... 2.9 1,340 1,820
31,033,800 US Bancorp ............................................. 1.8 969 1,123
17,072,192 USG Corp ................................................ 19.0 536 936
19,944,300 Wal-Mart Stores, Inc. .............................. 0.5 942 921
1,727,765 The Washington Post Company .............. 18.0 11 1,288
218,169,300 Wells Fargo & Company......................... 6.5 3,697 7,758
1,724,200 White Mountains Insurance..................... 16.0 369 999
Others ......................................................
5,866 8,315
Total Common Stocks ............................. $22,995 $61,533
*This is our actual purchase price and also our tax basis; GAAP “cost” differs in a few cases
because of write-ups or write-downs that have been required.
We are delighted by the 2006 business performance of virtually all of our investees. Last year, we
told you that our expectation was that these companies, in aggregate, would increase their earnings by 6%
to 8% annually, a rate that would double their earnings every ten years or so. In 2006 American Express,
15