Berkshire Hathaway 2006 Annual Report Download - page 55
Download and view the complete annual report
Please find page 55 of the 2006 Berkshire Hathaway annual report below. You can navigate through the pages in the report by either clicking on the pages listed below, or by using the keyword search tool below to find specific information within the annual report.-
 1
1 -
2
-
3
-
4
-
5
-
6
-
7
-
8
-
9
-
10
-
11
-
12
-
13
-
14
-
15
-
16
-
17
-
18
-
19
-
20
-
21
-
22
-
23
-
24
-
25
-
26
-
27
-
28
-
29
-
30
-
31
-
32
-
33
-
34
-
35
-
36
-
37
-
38
-
39
-
40
-
41
-
42
-
43
-
44
-
 45
45 -
 46
46 -
 47
47 -
 48
48 -
 49
49 -
 50
50 -
 51
51 -
 52
52 -
 53
53 -
 54
54 -
 55
55 -
 56
56 -
 57
57 -
 58
58 -
 59
59 -
 60
60 -
 61
61 -
 62
62 -
 63
63 -
 64
64 -
 65
65 -
66
-
67
-
68
-
69
-
70
-
71
-
72
-
73
-
74
-
75
-
76
-
77
-
78
-
79
-
80
-
81
-
82
 |
 |

54
BERKSHIRE HATHAWAY INC.
and Subsidiaries
Management’s Discussion and Analysis of
Financial Condition and Results of Operations
Results of Operations
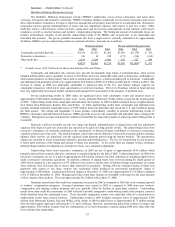
Net earnings for each of the past three years are disaggregated in the table that follows. Amounts are after deducting
income taxes and minority interests and are in millions.
2006 2005 2004
Insurance – underwriting............................................................................................... $ 2,485 $ 27 $1,008
Insurance – investment income..................................................................................... 3,120 2,412 2,045
Utilities and energy ....................................................................................................... 885 523 237
Manufacturing, service and retailing............................................................................. 2,131 1,646 1,540
Finance and financial products...................................................................................... 732 514 373
Other ............................................................................................................................. (47) (124) (154)
Investment and derivative gains/losses ......................................................................... 1,709 3,530 2,259
Net earnings...................................................................................................... $11,015 $8,528 $7,308
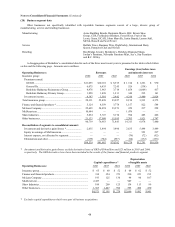
Berkshire’s operating businesses are managed on an unusually decentralized basis. There are essentially no centralized
or integrated business functions (such as sales, marketing, purchasing, legal or human resources) and there is minimal
involvement by Berkshire’s corporate headquarters in the day-to-day business activities of the operating businesses. Berkshire’s
corporate office management participates in and is ultimately responsible for significant capital allocation decisions, investment
activities and the selection of the Chief Executive to head each of the operating businesses. The business segment data (Note 20
to the Consolidated Financial Statements) should be read in conjunction with this discussion.
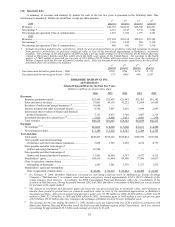
Insurance — Underwriting
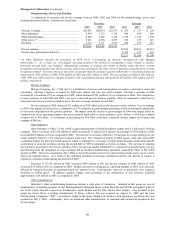
A summary follows of underwriting results from Berkshire’s insurance businesses for the past three years. Amounts
are in millions.
2006 2005 2004
Underwriting gain (loss) attributable to:
GEICO.................................................................................................................... $ 1,314 $ 1,221 $ 970
General Re .............................................................................................................. 526 (334) 3
Berkshire Hathaway Reinsurance Group................................................................ 1,658 (1,069) 417
Berkshire Hathaway Primary Group....................................................................... 340 235 161
Pre-tax underwriting gain.............................................................................................. 3,838 53 1,551
Income taxes and minority interests.............................................................................. 1,353 26 543
Net underwriting gain....................................................................................... $ 2,485 $ 27 $ 1,008
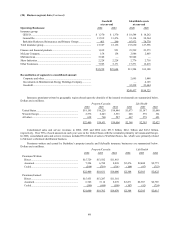
Berkshire engages in both primary insurance and reinsurance of property and casualty risks. Through General Re,
Berkshire also reinsures life and health risks. In primary insurance activities, Berkshire subsidiaries assume defined portions of
the risks of loss from persons or organizations that are directly subject to the risks. In reinsurance activities, Berkshire
subsidiaries assume defined portions of similar or dissimilar risks that other insurers or reinsurers have subjected themselves to in
their own insuring activities. Berkshire’s principal insurance and reinsurance businesses are: (1) GEICO, one of the four largest
auto insurers in the U.S., (2) General Re, (3) Berkshire Hathaway Reinsurance Group and (4) Berkshire Hathaway Primary
Group.
On June 30, 2005, Berkshire acquired Medical Protective Corporation (“MedPro”), a provider of professional liability
insurance to physicians, dentists and other healthcare providers. On May 19, 2006, Berkshire acquired 85% of Applied
Underwriters, a provider of integrated workers’ compensation solutions. Underwriting results for these businesses are included
in the Berkshire Hathaway Primary Group results beginning on their respective acquisition dates.
Berkshire’s management views insurance businesses as possessing two distinct operations – underwriting and
investing. Underwriting decisions are the responsibility of the unit managers; investing, with limited exceptions at GEICO and
General Re’s international operations, is the responsibility of Berkshire’s Chairman and CEO, Warren E. Buffett. Accordingly,
Berkshire evaluates performance of underwriting operations without any allocation of investment income.
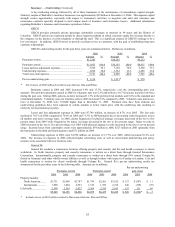
Periodic underwriting results can be affected significantly by changes in estimates for unpaid losses and loss
adjustment expenses, including amounts established for occurrences in prior years. See the Critical Accounting Policies section
of this discussion for information concerning the loss reserve estimation process. In addition, the timing and amount of
catastrophe losses can produce significant volatility in periodic underwriting results. During the third quarter of 2005,
Hurricanes Katrina and Rita struck the Gulf Coast region of the United States producing the largest catastrophe losses for any
quarter in the history of the property/casualty insurance industry. In the fourth quarter of 2005, Hurricane Wilma struck the
Southeast U.S. Estimated pre-tax losses from these events of $3.4 billion were recorded in 2005. In contrast, there were no
major hurricanes in 2006.