Berkshire Hathaway 2006 Annual Report Download - page 27
Download and view the complete annual report
Please find page 27 of the 2006 Berkshire Hathaway annual report below. You can navigate through the pages in the report by either clicking on the pages listed below, or by using the keyword search tool below to find specific information within the annual report.-
 1
1 -
2
-
3
-
4
-
5
-
6
-
7
-
8
-
9
-
10
-
11
-
12
-
13
-
14
-
15
-
16
-
 17
17 -
 18
18 -
 19
19 -
 20
20 -
 21
21 -
 22
22 -
 23
23 -
 24
24 -
 25
25 -
 26
26 -
 27
27 -
 28
28 -
 29
29 -
 30
30 -
 31
31 -
 32
32 -
 33
33 -
 34
34 -
 35
35 -
 36
36 -
 37
37 -
38
-
39
-
40
-
41
-
42
-
43
-
44
-
45
-
46
-
47
-
48
-
49
-
50
-
51
-
52
-
53
-
54
-
55
-
56
-
57
-
58
-
59
-
60
-
61
-
62
-
63
-
64
-
65
-
66
-
67
-
68
-
69
-
70
-
71
-
72
-
73
-
74
-
75
-
76
-
77
-
78
-
79
-
80
-
81
-
82
 |
 |

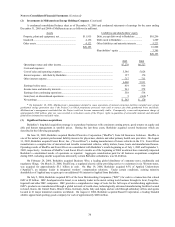
26
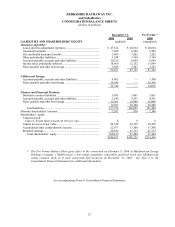
BERKSHIRE HATHAWAY INC.
and Subsidiaries
CONSOLIDATED BALANCE SHEETS
(dollars in millions)
December 31, Pro Forma *
2006 2005 2005
ASSETS (audited) (unaudited)
Insurance and Other:
Cash and cash equivalents ................................................................ $ 37,977 $ 40,471 $ 40,471
Invest
m
ents:
Fixed maturit
y
securities............................................................... 25,300 27,420 27,420
Equity securities............................................................................ 61,533 46,721 46,721
Othe
r
............................................................................................. 905 1,003 1,003
Receivables....................................................................................... 12,881 12,397 12,372
Inventories ........................................................................................ 5,257 4,143 4,143
Property, plant and equipment.......................................................... 9,303 7,500 7,500
Goodwill........................................................................................... 25,678 22,693 22,693
Deferred char
g
es reinsurance assumed............................................. 1,964 2,388 2,388
Othe
r
................................................................................................. 6,538 4,937 4,937
187,336 169,673 169,648
Utilities and Energy:
Cash and cash equivalents ................................................................ 343 — 358
Property, plant and equipment.......................................................... 24,039 — 11,915
Goodwill........................................................................................... 5,548
—
4,156
Othe
r
................................................................................................. 6,560
—
3,764
Investments in MidAmerican Energy Holdings Company............... — 4,125 —
36,490 4,125 20,193
F
inance and Financial Products:
Cash and cash equivalents ................................................................ 5,423 4,189 4,189
Investments in fixed maturity securities ........................................... 3,012 3,435 3,435
Loans and finance receivables .......................................................... 11,498 11,087 11,087
Goodwill........................................................................................... 1,012 951 951
Othe
r
................................................................................................. 3,666 4,865 4,865
24,611 24,527 24,527
$248,437 $198,325 $214,368
* The Pro Forma Balance Sheet gives effect to the conversion on February 9, 2006 of MidAmerican Energy
Holdings Company (“MidAmerican”) non-voting cumulative convertible preferred stock into MidAmerican
voting common stock as if such conversion had occurred on December 31, 2005. See Note 2 to the
Consolidated Financial Statements for additional information.
See accompanying Notes to Consolidated Financial Statements