Berkshire Hathaway 2006 Annual Report Download - page 30
Download and view the complete annual report
Please find page 30 of the 2006 Berkshire Hathaway annual report below. You can navigate through the pages in the report by either clicking on the pages listed below, or by using the keyword search tool below to find specific information within the annual report.-
 1
1 -
2
-
3
-
4
-
5
-
6
-
7
-
8
-
9
-
10
-
11
-
12
-
13
-
14
-
15
-
16
-
17
-
18
-
19
-
 20
20 -
 21
21 -
 22
22 -
 23
23 -
 24
24 -
 25
25 -
 26
26 -
 27
27 -
 28
28 -
 29
29 -
 30
30 -
 31
31 -
 32
32 -
 33
33 -
 34
34 -
 35
35 -
 36
36 -
 37
37 -
 38
38 -
 39
39 -
 40
40 -
41
-
42
-
43
-
44
-
45
-
46
-
47
-
48
-
49
-
50
-
51
-
52
-
53
-
54
-
55
-
56
-
57
-
58
-
59
-
60
-
61
-
62
-
63
-
64
-
65
-
66
-
67
-
68
-
69
-
70
-
71
-
72
-
73
-
74
-
75
-
76
-
77
-
78
-
79
-
80
-
81
-
82
 |
 |

29
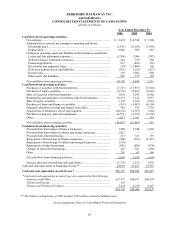
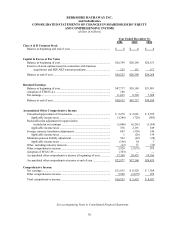
BERKSHIRE HATHAWAY INC.
and Subsidiaries
CONSOLIDATED STATEMENTS OF CASH FLOWS
(dollars in millions)
Year Ended December 31,
2006 2005 2004
Cash flows from operating activities:
Net earnings................................................................................................ $ 11,015 $ 8,528 $ 7,308
Adjustments to reconcile net earnings to operating cash flows:
Investment gains ...................................................................................... (1,811) (6,196) (1,636)
Depreciation............................................................................................. 2,066 982 941
Changes in operating assets and liabilities before business acquisitions:
Losses and loss adjustment expenses....................................................... (2,704) 2,086 (383)
Deferred charges reinsurance assumed .................................................... 424 339 360
Unearned premiums................................................................................. 637 (239) (52)
Receivables and originated loans............................................................. (59) (1,849) 102
Derivative contract assets and liabilities .................................................. (563) 3,620 (367)
Income taxes ............................................................................................ 303 1,602 860
Other assets and liabilities ....................................................................... 887 573 178
Net cash flows from operating activities .................................................... 10,195 9,446 7,311
Cash flows from investing activities:
Purchases of securities with fixed maturities.............................................. (7,747) (13,937) (5,924)
Purchases of equity securities..................................................................... (9,173) (8,021) (2,032)
Sales of securities with fixed maturities ..................................................... 1,818 3,243 4,560
Redemptions and maturities of securities with fixed maturities ................. 10,313 7,142 5,637
Sales of equity securities ............................................................................ 3,778 1,629 2,610
Purchases of loans and finance receivables ................................................ (365) (1,987) (6,314)
Principal collections on loans and finance receivables............................... 985 911 2,736
Acquisitions of businesses, net of cash acquired........................................ (10,132) (2,387) (414)
Purchases of property, plant and equipment............................................... (4,571) (2,195) (1,278)
Other........................................................................................................... 1,017 1,761 734
Net cash flows from investing activities..................................................... (14,077) (13,841) 315
Cash flows from financing activities:
Proceeds from borrowings of finance businesses ....................................... 1,280 5,628 1,668
Proceeds from borrowings of utilities and energy businesses .................... 2,417 — —
Proceeds from other borrowings................................................................. 215 521 339
Repayments of borrowings of finance businesses ...................................... (244) (319) (1,267)
Repayments of borrowings of utilities and energy businesses ................... (516) — —
Repayments of other borrowings................................................................ (991) (628) (674)
Changes in short term borrowings.............................................................. 245 361 (388)
Other........................................................................................................... 201 65 166
Net cash flows from financing activities .................................................... 2,607 5,628 (156)
Increase (decrease) in cash and cash equivalents ....................................... (1,275) 1,233 7,470
Cash and cash equivalents at beginning of year ** .......................................... 45,018 43,427 35,957
Cash and cash equivalents at end of year *.................................................. $43,743 $44,660 $43,427
* Cash and cash equivalents at end of year are comprised of the following:
Insurance and Other................................................................................... $37,977 $40,471 $40,020
Utilities and Energy.................................................................................... 343 — —
Finance and Financial Products ................................................................ 5,423 4,189 3,407
$43,743 $44,660 $43,427
** The balance at beginning of 2006 includes $358 million related to MidAmerican.
See accompanying Notes to Consolidated Financial Statements