Berkshire Hathaway 2006 Annual Report Download - page 41
Download and view the complete annual report
Please find page 41 of the 2006 Berkshire Hathaway annual report below. You can navigate through the pages in the report by either clicking on the pages listed below, or by using the keyword search tool below to find specific information within the annual report.-
 1
1 -
2
-
3
-
4
-
5
-
6
-
7
-
8
-
9
-
10
-
11
-
12
-
13
-
14
-
15
-
16
-
17
-
18
-
19
-
20
-
21
-
22
-
23
-
24
-
25
-
26
-
27
-
28
-
29
-
30
-
 31
31 -
 32
32 -
 33
33 -
 34
34 -
 35
35 -
 36
36 -
 37
37 -
 38
38 -
 39
39 -
 40
40 -
 41
41 -
 42
42 -
 43
43 -
 44
44 -
 45
45 -
 46
46 -
 47
47 -
 48
48 -
 49
49 -
 50
50 -
 51
51 -
52
-
53
-
54
-
55
-
56
-
57
-
58
-
59
-
60
-
61
-
62
-
63
-
64
-
65
-
66
-
67
-
68
-
69
-
70
-
71
-
72
-
73
-
74
-
75
-
76
-
77
-
78
-
79
-
80
-
81
-
82
 |
 |

40
Notes to Consolidated Financial Statements (Continued)
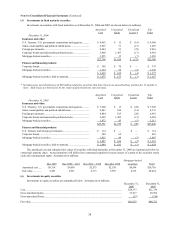
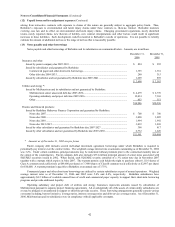
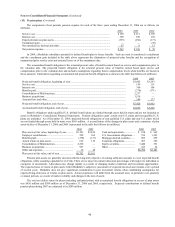
(10) Property, plant and equipment (Continued)
Property, plant and equipment of utilities and energy businesses is comprised of the following (in millions):
Pro Forma
Ranges of December 31, December 31,
estimated useful life 2006 2005
Utility generation and distribution system...................... 5-85 years $27,687 $10,499
Interstate pipeline assets................................................. 3-67 years 5,329 5,322
Independent power plants and other assets..................... 3-30 years 1,770 1,861
Construction in progress ................................................ 1,969 847
36,755 18,529
Accumulated depreciation and amortization .................. (12,716) (6,614)
$24,039 $11,915
The utility generation and distribution system and interstate pipeline assets are the regulated assets of public utility and natural
gas pipeline subsidiaries. At December 31, 2006 and December 31, 2005, accumulated depreciation and amortization related to
regulated assets was $11.9 billion and $5.7 billion, respectively. Substantially all of the construction in progress at
December 31, 2006 and December 31, 2005 related to the construction of regulated assets.
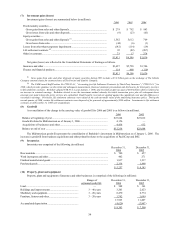
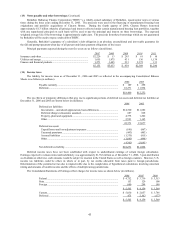
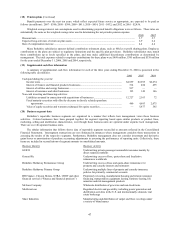
(11) Derivatives
A summary of the fair value and gross notional value of open derivative contracts of finance and financial products businesses
follows. Amounts are in millions.
December 31, 2006 December 31, 2005
Notional Notional
Assets Liabilities Value Assets Liabilities Value
Credit default obligations ................................... $ — $ 952 $ 2,510 $ — $ 1,609 $ 2,871
Equity options .................................................... 16 2,463 21,396 35 1,592 14,488
Foreign currency forwards ................................. — 23 1,057 12 243 13,760
Foreign currency options.................................... 40 36 1,094 117 241 2,072
Interest rate and foreign currency swaps ............ 632 473 10,851 977 1,533 41,070
Interest rate options............................................ 13 13 3,085 164 347 12,033
701 3,960 1,305 5,565
Adjustment for counterparty netting .................. (77) (77) (504) (504)
Derivative contract assets and liabilities ............ $ 624 $ 3,883 $ 801 $ 5,061
Berkshire utilizes derivatives in order to manage certain economic risks of its businesses as well as to assume specified
amounts of market risk from others. The contracts summarized in the preceding table, with limited exceptions, are not designated as
hedges for financial reporting purposes. Changes in the fair values of derivative assets and derivative liabilities that do not qualify as
hedges are reported in the Consolidated Statements of Earnings as derivative gains/losses. Since January 2002, the operations of
General Re Securities (“GRS”) have been in run-off. As of December 31, 2006, substantially all of GRS’ s derivative risks (as
measured by the gross notional value) that existed as of the commencement of the run-off have been liquidated.
Master netting agreements are utilized to manage counterparty credit risk, where gains and losses are netted across other
contracts with that counterparty. In addition, Berkshire may receive cash or securities from counterparties as collateral. Likewise,
Berkshire may be required to post cash or securities as collateral with counterparties under similar circumstances. At December 31,
2006, Berkshire held collateral with a fair value of $338 million, including cash of $314 million to secure open contract assets. At
December 31, 2006, Berkshire had posted no collateral with counterparties as security on contract liabilities. Berkshire may be
required to post collateral to cover derivative liabilities in the event of a downgrade of its credit rating below specified levels.
Assuming non-performance by all counterparties on all contracts potentially subject to a credit loss, the maximum potential
receivable loss, net of collateral held, at December 31, 2006 approximated $274 million.
Berkshire is also exposed to variations in the market prices of natural gas and electricity as a result of its regulated utility
operations and uses derivative instruments, including forward purchases and sales, futures, swaps and options to manage these
commodity price risks. Derivative instruments are recorded in the Consolidated Balance Sheets at fair value as either assets or
liabilities unless they are designated as and qualify for normal purchases and normal sales exemptions under GAAP. The majority of
these contracts are either probable of recovery in rates and therefore recorded as a regulatory net asset or liability or are accounted for
as cash flow hedges and therefore recorded as accumulated other comprehensive income. Accordingly, amounts are generally not
recognized in earnings until the contracts are settled.