Berkshire Hathaway 2006 Annual Report Download - page 59
Download and view the complete annual report
Please find page 59 of the 2006 Berkshire Hathaway annual report below. You can navigate through the pages in the report by either clicking on the pages listed below, or by using the keyword search tool below to find specific information within the annual report.-
 1
1 -
2
-
3
-
4
-
5
-
6
-
7
-
8
-
9
-
10
-
11
-
12
-
13
-
14
-
15
-
16
-
17
-
18
-
19
-
20
-
21
-
22
-
23
-
24
-
25
-
26
-
27
-
28
-
29
-
30
-
31
-
32
-
33
-
34
-
35
-
36
-
37
-
38
-
39
-
40
-
41
-
42
-
43
-
44
-
45
-
46
-
47
-
48
-
 49
49 -
 50
50 -
 51
51 -
 52
52 -
 53
53 -
 54
54 -
 55
55 -
 56
56 -
 57
57 -
 58
58 -
 59
59 -
 60
60 -
 61
61 -
 62
62 -
 63
63 -
 64
64 -
 65
65 -
 66
66 -
 67
67 -
 68
68 -
 69
69 -
70
-
71
-
72
-
73
-
74
-
75
-
76
-
77
-
78
-
79
-
80
-
81
-
82
 |
 |

58
Management’s Discussion (Continued)
Insurance — Underwriting (Continued)
Berkshire Hathaway Reinsurance Group (Continued)
In November 2006, BHRG and Equitas, a London based entity established to reinsure and manage the 1992 and prior
years’ non-life liabilities of the Names or Underwriters at Lloyd’s of London, entered into an agreement for BHRG to provide
potentially up to $7 billion of new excess reinsurance to Equitas. BHRG will also employ the current staff of Equitas and
manage the run-off of Equitas’ liabilities. The agreement is subject to the approval by certain regulatory authorities in the
United States and the United Kingdom as well as various other conditions which must be obtained by March 31, 2007.
Consideration payable to BHRG under the arrangement would initially consist of all of Equitas’ assets less 100 million Pounds
Sterling.
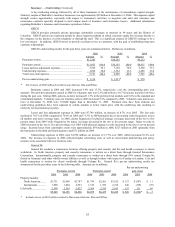
Berkshire Hathaway Primary Group
Berkshire’s primary insurance group consists of a wide variety of smaller insurance businesses that principally write
liability coverages for commercial accounts. These businesses include: National Indemnity Company’s primary group operation
(“NICO Primary Group”), a writer of motor vehicle and general liability coverages; U.S. Investment Corporation (“USIC”),
whose subsidiaries underwrite specialty insurance coverages; a group of companies referred to internally as “Homestate”
operations, providers of standard multi-line insurance; Central States Indemnity Company (“CSI”), a provider of credit and
disability insurance to individuals nationwide through financial institutions; and MedPro and Applied Underwriters, which as
previously noted were acquired in June 2005 and May 2006, respectively.
Collectively, Berkshire’s primary insurance businesses produced earned premiums of $1,858 million in 2006, $1,498
million in 2005 and $1,211 million in 2004. The increase in premiums earned in 2006 was primarily attributable to the impact of
the MedPro and Applied Underwriters acquisitions partially offset by a decline in volume of the NICO Primary Group.
Premiums earned in the last half of 2005 by MedPro accounted for most of the increase in total premiums earned by the primary
group in 2005 compared with 2004. Pre-tax underwriting gains as percentages of premiums earned were approximately 18% in
2006, 16% in 2005 and 13% in 2004. Underwriting gains in 2006 were achieved in all of the businesses. The underwriting gain
in 2005 reflected a decrease in loss reserve estimates for pre-2005 loss events in the NICO Primary Group business, improved
results of Homestate, USIC and CSI operations partially offset by losses incurred from increases in medical malpractice reserves.
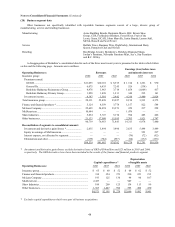
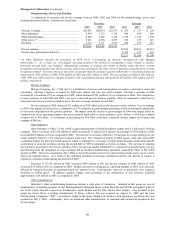
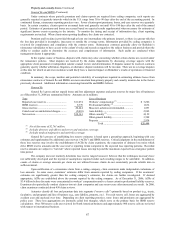
Insurance — Investment Income
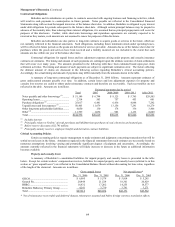
Following is a summary of the net investment income of Berkshire’s insurance operations for the past three years.
Amounts are in millions.
2006 2005 2004
Investment income before taxes........................................................................................ $4,316 $3,480 $2,824
Income taxes and minority interests.................................................................................. 1,196 1,068 779
Investment income after taxes and minority interests ....................................................... $3,120 $2,412 $2,045
Investment income consists of interest and dividends earned on cash equivalents and fixed maturity and equity
investments of Berkshire’s insurance businesses. Pre-tax investment income earned in 2006 by Berkshire’s insurance businesses
increased $836 million (24%) over 2005, which increased $656 million (23%) over 2004. The increase in 2006 reflects higher
short-term interest rates in the United States and increased dividends as compared to 2005. The increase in investment income in
2005 primarily reflects higher short-term interest rates in the United States as compared to 2004.
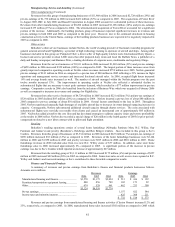
A summary of investments held in Berkshire’s insurance businesses follows. Dollar amounts are in millions.
Dec. 31,
2006
Dec. 31,
2005
Dec. 31,
2004
Cash and cash equivalents............................................................................................... $ 34,590 $ 38,814 $ 38,706
Equity securities .............................................................................................................. 61,168 46,412 37,420
Fixed maturity securities ................................................................................................. 25,272 27,385 22,831
Other................................................................................................................................ 812 918 2,059
$121,842 $113,529 $101,016
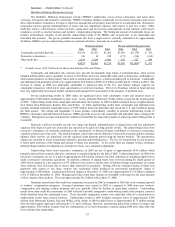
Fixed maturity investments as of December 31, 2006 were as follows. Amounts are in millions.
Amortized
cost
Unrealized
gains/losses
Fair value
U.S. Treasury, government corporations and agencies ................................................. $ 4,941 $ (2) $ 4,939
States, municipalities and political subdivisions ........................................................... 2,967 56 3,023
Foreign governments..................................................................................................... 8,444 (28) 8,416
Corporate bonds and redeemable preferred stocks, investment grade........................... 3,610 150 3,760
Corporate bonds and redeemable preferred stocks, non-investment grade.................... 1,858 1,300 3,158
Mortgage-backed securities........................................................................................... 1,948 28 1,976
$23,768 $ 1,504 $25,272