Berkshire Hathaway 2006 Annual Report Download - page 42
Download and view the complete annual report
Please find page 42 of the 2006 Berkshire Hathaway annual report below. You can navigate through the pages in the report by either clicking on the pages listed below, or by using the keyword search tool below to find specific information within the annual report.-
 1
1 -
2
-
3
-
4
-
5
-
6
-
7
-
8
-
9
-
10
-
11
-
12
-
13
-
14
-
15
-
16
-
17
-
18
-
19
-
20
-
21
-
22
-
23
-
24
-
25
-
26
-
27
-
28
-
29
-
30
-
31
-
 32
32 -
 33
33 -
 34
34 -
 35
35 -
 36
36 -
 37
37 -
 38
38 -
 39
39 -
 40
40 -
 41
41 -
 42
42 -
 43
43 -
 44
44 -
 45
45 -
 46
46 -
 47
47 -
 48
48 -
 49
49 -
 50
50 -
 51
51 -
 52
52 -
53
-
54
-
55
-
56
-
57
-
58
-
59
-
60
-
61
-
62
-
63
-
64
-
65
-
66
-
67
-
68
-
69
-
70
-
71
-
72
-
73
-
74
-
75
-
76
-
77
-
78
-
79
-
80
-
81
-
82
 |
 |

41
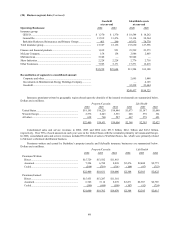
(11) Derivatives (Continued)
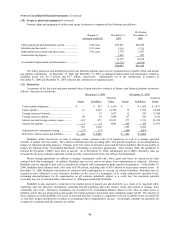
Fair values and gross notional values of open derivative contracts of utilities and energy businesses as of December 31, 2006
follow (in millions).
Notional
Assets Liabilities Value
Energy derivatives..................................................................................... $ 467 $ 740 *
Interest rate and foreign currency swaps ................................................... 17 149 $2,123
$ 484 $ 889
* Notional values associated with commodity and weather-related derivatives are not presented due to the unique units of
measure pertinent to such contracts. Notional values for commodity and weather contracts are not stated in terms of dollars.
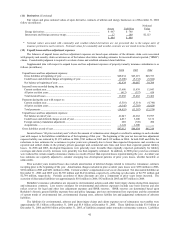
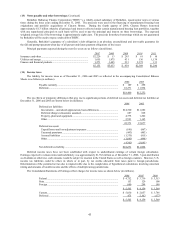
(12) Unpaid losses and loss adjustment expenses
The balances of unpaid losses and loss adjustment expenses are based upon estimates of the ultimate claim costs associated
with property and casualty claim occurrences as of the balance sheet dates including estimates for incurred but not reported (“IBNR”)
claims. Considerable judgment is required to evaluate claims and establish estimated claim liabilities.
Supplemental data with respect to unpaid losses and loss adjustment expenses of property/casualty insurance subsidiaries is as
follows (in millions).
2006 2005 2004
Unpaid losses and loss adjustment expenses:
Gross liabilities at beginning of year.............................................................................. $48,034 $45,219 $45,393
Ceded losses and deferred charges at beginning of year ................................................ (5,200) (5,132) (5,684)
Net balance at beginning of year .................................................................................... 42,834 40,087 39,709
Incurred losses recorded during the year:
Current accident year...................................................................................................... 13,680 15,839 13,043
All prior accident years................................................................................................... (612) (357) 419
Total incurred losses....................................................................................................... 13,068 15,482 13,462
Payments during the year with respect to:
Current accident year...................................................................................................... (5,510) (5,514) (4,746)
All prior accident years................................................................................................... (9,345) (7,793) (8,828)
Total payments ............................................................................................................... (14,855) (13,307) (13,574)
Unpaid losses and loss adjustment expenses:
Net balance at end of year .............................................................................................. 41,047 42,262 39,597
Ceded losses and deferred charges at end of year .......................................................... 4,833 5,200 5,132
Foreign currency translation adjustment ........................................................................ 608 (728) 490
Acquisitions.................................................................................................................... 1,124 1,300 —
Gross liabilities at end of year ........................................................................................... $47,612 $48,034 $45,219
Incurred losses “all prior accident years” reflects the amount of estimation error charged or credited to earnings in each calendar
year with respect to the liabilities established as of the beginning of that year. The beginning of the year net loss and loss adjustment
expense liability was reduced by $1,071 million in 2006, $743 million in 2005 and $119 million in 2004. In both 2005 and 2006, the
reductions in loss estimates for occurrences in prior years were primarily due to lower than expected frequencies and severities on
reported and settled claims in the primary private passenger and commercial auto lines and lower than expected general liability
losses. In 2006 and 2005, developed frequencies were generally more favorable than originally expected, particularly for liability
coverages and claim severity increases were generally less than originally estimated. In addition, in 2006 prior years loss estimates
were reduced for certain casualty reinsurance claims as a result of lower than expected losses reported during the year. Accident year
loss estimates are regularly adjusted to consider emerging loss development patterns of prior years losses, whether favorable or
unfavorable.
Prior accident years incurred losses also include amortization of deferred charges related to retroactive reinsurance contracts
incepting prior to the beginning of the year. Amortization charges included in prior accident years losses were $358 million in 2006,
$294 million in 2005 and $451 million in 2004. Certain workers’ compensation reserves are discounted. Net discounted liabilities at
December 31, 2006 and 2005 were $2,705 million and $2,434 million, respectively, reflecting net discounts of $2,793 million and
$2,798 million, respectively. Periodic accretions of these discounts are also a component of prior years losses incurred. The
accretion of discounted liabilities was approximately $101 million in 2006, $92 million in 2005 and $87 million in 2004.
Berkshire’ s insurance subsidiaries are exposed to environmental, asbestos and other latent injury claims arising from insurance
and reinsurance contracts. Loss reserve estimates for environmental and asbestos exposures include case basis reserves and also
reflect reserves for legal and other loss adjustment expenses and IBNR reserves. IBNR reserves are determined based upon
Berkshire’ s historic general liability exposure base and policy language, previous environmental loss experience and the assessment
of current trends of environmental law, environmental cleanup costs, asbestos liability law and judgmental settlements of asbestos
liabilities.
The liabilities for environmental, asbestos and latent injury claims and claims expenses net of reinsurance recoverables were
approximately $5.1 billion at December 31, 2006 and $5.4 billion at December 31, 2005. These liabilities include $3.8 billion at
December 31, 2006 and $4.0 billion at December 31, 2005, of liabilities assumed under retroactive reinsurance contracts. Liabilities