Berkshire Hathaway 2006 Annual Report Download - page 29
Download and view the complete annual report
Please find page 29 of the 2006 Berkshire Hathaway annual report below. You can navigate through the pages in the report by either clicking on the pages listed below, or by using the keyword search tool below to find specific information within the annual report.-
 1
1 -
2
-
3
-
4
-
5
-
6
-
7
-
8
-
9
-
10
-
11
-
12
-
13
-
14
-
15
-
16
-
17
-
18
-
 19
19 -
 20
20 -
 21
21 -
 22
22 -
 23
23 -
 24
24 -
 25
25 -
 26
26 -
 27
27 -
 28
28 -
 29
29 -
 30
30 -
 31
31 -
 32
32 -
 33
33 -
 34
34 -
 35
35 -
 36
36 -
 37
37 -
 38
38 -
 39
39 -
40
-
41
-
42
-
43
-
44
-
45
-
46
-
47
-
48
-
49
-
50
-
51
-
52
-
53
-
54
-
55
-
56
-
57
-
58
-
59
-
60
-
61
-
62
-
63
-
64
-
65
-
66
-
67
-
68
-
69
-
70
-
71
-
72
-
73
-
74
-
75
-
76
-
77
-
78
-
79
-
80
-
81
-
82
 |
 |

28
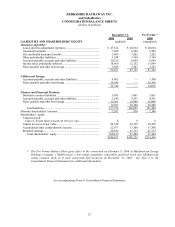
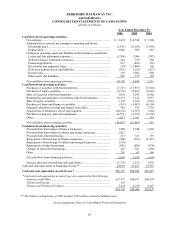
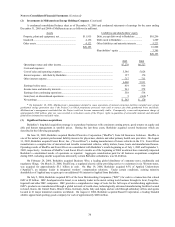
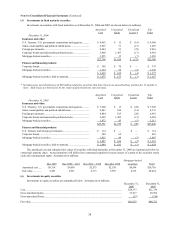
BERKSHIRE HATHAWAY INC.
and Subsidiaries
CONSOLIDATED STATEMENTS OF EARNINGS
(dollars in millions except per share amounts)
Year Ended December 31,
2006 2005 2004
Revenues:
Insurance and Other:
Insurance premiums earned.............................................................. $23,964 $21,997 $21,085
Sales and service revenues ............................................................... 51,803 46,138 43,222
Interest, dividend and other investment income ............................... 4,382 3,487 2,816
Investment gains/losses .................................................................... 1,697 5,728 1,746
81,846 77,350 68,869
Utilities and Energy:
Operating revenues........................................................................... 10,301 — —
Other................................................................................................. 343 — —
10,644 — —
Finance and Financial Products:
Interest income ................................................................................. 1,610 1,554 1,202
Investment gains/losses .................................................................... 114 468 (110)
Derivative gains/losses ..................................................................... 824 (788) 1,835
Other................................................................................................. 3,501 3,079 2,586
6,049 4,313 5,513
98,539 81,663 74,382
Costs and expenses:
Insurance and Other:
Insurance losses and loss adjustment expenses ................................ 13,068 15,482 13,462
Life and health insurance benefits.................................................... 1,618 1,634 1,361
Insurance underwriting expenses...................................................... 5,440 4,828 4,711
Cost of sales and services................................................................. 42,416 38,288 35,882
Selling, general and administrative expenses ................................... 5,932 5,328 4,989
Interest expense ................................................................................ 195 144 137
68,669 65,704 60,542
Utilities and Energy:
Cost of sales and operating expenses ............................................... 8,189 — —
Interest expense................................................................................ 979 — —
9,168 — —
Finance and Financial Products:
Interest expense................................................................................ 550 579 584
Other................................................................................................. 3,374 3,112 2,557
3,924 3,691 3,141
81,761 69,395 63,683
Earnin
g
s before income taxes and e
q
uit
y
in earnin
g
s of
MidAmerican Energy Holdings Company................................... 16,778 12,268 10,699
Equity in earnings of MidAmerican Energy Holdings Company........ — 523 237
Earnings before income taxes and minority interests .................... 16,778 12,791 10,936
Income taxes..................................................................................... 5,505 4,159 3,569
Minority shareholders’ interests ....................................................... 258 104 59
Net earnings ....................................................................................... $11,015 $ 8,528 $ 7,308
Average common shares outstanding * ............................................ 1,541,807 1,539,775 1,537,716
Net earnings per common share *.................................................... $ 7,144 $ 5,538 $ 4,753
* Average shares outstanding include average Class A common shares and average Class B common shares
determined on an equivalent Class A common stock basis. Net earnings per common share shown above represents
net earnings per equivalent Class A common share. Net earnings per Class B common share is equal to one-
thirtieth (1/30) of such amount or $238 per share for 2006, $185 per share for 2005 and $158 per share for 2004.
See accompanying Notes to Consolidated Financial Statements