Berkshire Hathaway 2006 Annual Report Download - page 60
Download and view the complete annual report
Please find page 60 of the 2006 Berkshire Hathaway annual report below. You can navigate through the pages in the report by either clicking on the pages listed below, or by using the keyword search tool below to find specific information within the annual report.-
 1
1 -
2
-
3
-
4
-
5
-
6
-
7
-
8
-
9
-
10
-
11
-
12
-
13
-
14
-
15
-
16
-
17
-
18
-
19
-
20
-
21
-
22
-
23
-
24
-
25
-
26
-
27
-
28
-
29
-
30
-
31
-
32
-
33
-
34
-
35
-
36
-
37
-
38
-
39
-
40
-
41
-
42
-
43
-
44
-
45
-
46
-
47
-
48
-
49
-
 50
50 -
 51
51 -
 52
52 -
 53
53 -
 54
54 -
 55
55 -
 56
56 -
 57
57 -
 58
58 -
 59
59 -
 60
60 -
 61
61 -
 62
62 -
 63
63 -
 64
64 -
 65
65 -
 66
66 -
 67
67 -
 68
68 -
 69
69 -
 70
70 -
71
-
72
-
73
-
74
-
75
-
76
-
77
-
78
-
79
-
80
-
81
-
82
 |
 |

59
Insurance — Investment Income (Continued)
All U.S. government obligations are rated AAA by the major rating agencies and 96% of all state, municipal and
political subdivisions, foreign government obligations and mortgage-backed securities were rated AA or higher. Non-investment
grade securities represent securities that are rated below BBB- or Baa3.
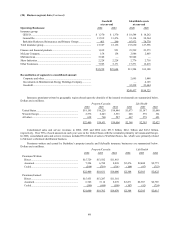
Invested assets derive from shareholder capital and reinvested earnings as well as net liabilities assumed under
insurance contracts or “float.” The major components of float are unpaid losses, unearned premiums and other liabilities to
policyholders less premiums and reinsurance receivables, deferred charges assumed under retroactive reinsurance contracts and
deferred policy acquisition costs. Float approximated $50.9 billion at December 31, 2006, $49.3 billion at December 31, 2005
and $46.1 billion at December 31, 2004. The cost of float, as represented by the ratio of pre-tax underwriting gain or loss to
average float, was negative for the last three years, as Berkshire’s insurance businesses generated pre-tax underwriting gains in
each year.
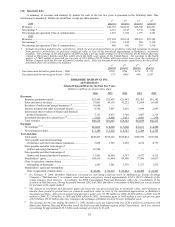
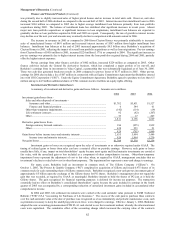
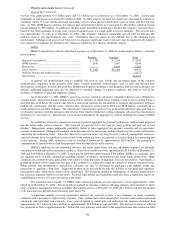
Utilities and Energy (“MidAmerican”)
Revenues and earnings from MidAmerican for each of the past three years are summarized below. Amounts are in
millions.
Revenues Earnings
2006 2005 2004 2006 2005 2004
MidAmerican Energy Company ............................... $ 3,519 $3,200 $2,731 $ 348 $ 288 $ 268
PacifiCorp .................................................................. 2,971 — — 356 — —
Natural gas pipelines.................................................. 972 909 884 376 309 289
U.K. utilities............................................................... 961 921 955 338 308 326
Real estate brokerage................................................. 1,724 1,894 1,777 74 148 130
Other .......................................................................... 497 356 380 226 115 (406)
$10,644 $7,280 $6,727
Earnings before corporate interest and taxes............. 1,718 1,168 607
Interest, other than to Berkshire ................................ (261) (200) (212)
Interest on Berkshire junior debt ............................... (134) (157) (170)
Income tax.................................................................. (407) (248) (55)
Net earnings ................................................... $ 916 $ 563 $ 170
Earnings applicable to Berkshire *............................ $ 885 $ 523* $ 237*
Debt owed to others................................................... 16,946 10,296 10,528
Debt owed to Berkshire ............................................. 1,055 1,289 1,478
* Net of minority interests and includes interest earned by Berkshire (net of related income taxes). Also includes additional
income tax charges of $49 million and $15 million in 2005 and 2004, respectively, related to Berkshire’s accounting for
MidAmerican under the equity method.
Berkshire’s 2005 and 2004 Consolidated Financial Statements reflect Berkshire’s share of MidAmerican’s net earnings
as determined under the equity method. In 2006, MidAmerican’s revenues and expenses are consolidated in Berkshire’s
financial statements. For comparative purposes, revenues and earnings of MidAmerican for 2005 and 2004 are provided in the
table above. Revenues and earnings of the utilities and energy businesses are, to some extent, seasonal depending on weather-
induced demand. Revenues from U.S. electricity sales are generally higher in the summer when air conditioning use is greatest
and revenues from gas sales and pipelines are generally higher in the winter when heating needs are higher. Real estate
brokerage revenues tend to be highest in the second and third quarters.
MidAmerican’s revenues of $10,644 million in 2006 increased $3,364 million (46%) and earnings before corporate
interest and taxes (“EBIT”) of $1,718 million in 2006 increased $550 million (47%) as compared to 2005. The increases in
revenues and EBIT were largely attributable to the acquisition of PacifiCorp on March 21, 2006. Revenues of MidAmerican
Energy Company (“MEC”) of $3,519 million increased $319 million (10%) as compared to 2005. Major factors giving rise to
MEC’s revenue increase were a change in strategy related to certain end use natural gas contracts that resulted in revenues and
costs being recorded on a gross rather than net basis and higher wholesale electricity sales due to both price and volume
increases. Somewhat offsetting these increases were lower natural gas sales due to mild temperatures in 2006. EBIT of MEC
increased $60 million (21%) as compared to 2005. About Ҁ of the increase was due to improved margins on regulated
electricity sales.
Revenues from natural gas pipelines of $972 million in 2006 increased $63 million (7%) and EBIT of $376 million in
2006 increased $67 million (22%) as compared to 2005. The comparative improvement in revenues and EBIT was primarily due
to favorable market conditions resulting in higher demand and rates as well as additional transportation and storage services.
EBIT of the U.K. utilities business of $338 million in 2006 increased $30 million (10%) as compared to 2005. The increase was
due to an increase in regulated revenues as well as a favorable impact from the strengthening of the Pound Sterling versus the
U.S. dollar.
Revenues from the real estate brokerage business of $1,724 million in 2006 decreased $170 million (9%) and EBIT of
$74 million in 2006 decreased $74 million (50%) as compared to 2005. The declines were due to a significant reduction in the
number of closed transactions due to the significant slowdown in U.S. residential real estate activity.
EBIT from other activities of $226 million in 2006 increased $111 million as compared to 2005. Most of this increase
arose from a gain on the sale of a security that was received in connection with a bankruptcy claim award as well as from sales of
other investments. In 2004, EBIT includes an impairment charge of $579 million related to the discontinuance of the operations
of MidAmerican’s mineral extraction facility.