Berkshire Hathaway 2006 Annual Report Download - page 61
Download and view the complete annual report
Please find page 61 of the 2006 Berkshire Hathaway annual report below. You can navigate through the pages in the report by either clicking on the pages listed below, or by using the keyword search tool below to find specific information within the annual report.-
 1
1 -
2
-
3
-
4
-
5
-
6
-
7
-
8
-
9
-
10
-
11
-
12
-
13
-
14
-
15
-
16
-
17
-
18
-
19
-
20
-
21
-
22
-
23
-
24
-
25
-
26
-
27
-
28
-
29
-
30
-
31
-
32
-
33
-
34
-
35
-
36
-
37
-
38
-
39
-
40
-
41
-
42
-
43
-
44
-
45
-
46
-
47
-
48
-
49
-
50
-
 51
51 -
 52
52 -
 53
53 -
 54
54 -
 55
55 -
 56
56 -
 57
57 -
 58
58 -
 59
59 -
 60
60 -
 61
61 -
 62
62 -
 63
63 -
 64
64 -
 65
65 -
 66
66 -
 67
67 -
 68
68 -
 69
69 -
 70
70 -
 71
71 -
72
-
73
-
74
-
75
-
76
-
77
-
78
-
79
-
80
-
81
-
82
 |
 |

60
Management’s Discussion (Continued)
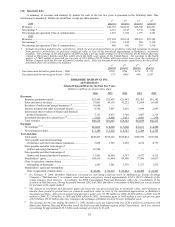
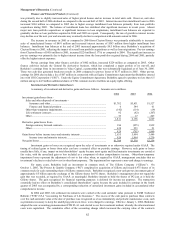
Manufacturing, Service and Retailing
A comparison of revenues and pre-tax earnings between 2006, 2005 and 2004 for the manufacturing, service and
retailing businesses follows. Amounts are in millions.
Revenues Earnings
2006 2005 2004 2006 2005 2004
McLane Company.......................................................... $25,693 $24,074 $23,373 $ 229 $ 217 $ 228
Shaw Industries .............................................................. 5,834 5,723 5,174 594 485 466
Other manufacturing ...................................................... 11,988 9,260 8,152 1,756 1,335 1,160
Other service * ............................................................... 5,811 4,728 4,507 658 329 412
Retailing......................................................................... 3,334 3,111 2,936 289 257 215
$52,660 $46,896 $44,142
Pre-tax earnings.............................................................. $3,526 $2,623 $2,481
Income taxes and minority interests............................... 1,395 977 941
$2,131 $1,646 $1,540
* In 2004, Berkshire adopted the provisions of EITF 00-21 (“Accounting for Revenue Arrangements with Multiple
Deliverables”). As a result, for consolidated reporting purposes, the method of recognizing revenue related to NetJets’
fractional aircraft sales was changed. Management continues to evaluate the results of NetJets under the prior revenue
recognition criteria and thus has shown revenues and pre-tax earnings for the other services businesses using the prior revenue
recognition method. Revenues shown in this table are greater than the amounts reported in Berkshire’s consolidated financial
statements by $781 million in 2006, $704 million in 2005 and $902 million in 2004. Pre-tax earnings included in this table for
2006, 2005 and 2004 exceed the amounts included in the consolidated financial statements by $79 million, $63 million and $74
million, respectively.
McLane Company
McLane Company, Inc., (“McLane”) is a distributor of grocery and food products to retailers, convenience stores and
restaurants. McLane’s business is marked by high sales volume and very low profit margins. McLane’s revenues in 2006
increased $1,619 million (7%) as compared to 2005, which increased $701 million (3%) as compared to 2004. The comparative
revenue increases in both 2006 and 2005 were due to increased grocery business partially offset by comparative reductions in
restaurant food service revenues primarily due to the loss of a large customer in mid-2005.
Pre-tax earnings in 2006 increased $12 million over 2005 which reflects the increase in sales volume. Pre-tax earnings
in 2006 were negatively affected by a comparative 0.13% reduction in gross margin percentage which was primarily attributable
to increased competition in the grocery business. The impact from the decline in gross margin in 2006 was largely offset by
comparatively lower operating expenses that were primarily attributable to lower insurance costs. About ѿ of McLane’s annual
revenues are to Wal-Mart. A curtailment of purchasing by Wal-Mart could have a material adverse impact on revenues and
earnings of McLane.
Shaw Industries
Shaw Industries (“Shaw”) is the world’s largest manufacturer of tufted broadloom carpets and is a full-service flooring
company. Shaw’s revenues of $5,834 million in 2006 increased $111 million (2%) and pre-tax earnings of $594 million in 2006
increased $109 million (22%) as compared to 2005. The increase in revenues reflected a 7% increase in average selling price for
carpet, partially offset by a 6% reduction in square yards sold. The comparative decline in 2006 square yards sold versus 2005
accelerated during the third and fourth quarters, which is attributed to a slowing of single-family housing construction and the
acceleration of customer purchases during the second half of 2005 in anticipation of price increases. The increase in earnings
was primarily generated in the first six months of the year and was mainly attributable to a reduction in manufacturing cost per
unit deriving from the integration of carpet backing and nylon-fiber manufacturing operations acquired by Shaw in the fourth
quarter of 2005. These two acquisitions allow Shaw to internally produce most of its carpet backing needs and to secure a more
stable raw material source. As a result of the continued slowdown in housing construction activity, the decline in volume is
expected to continue at least during the first half of 2007.
Revenues of $5,723 million in 2005 increased $549 million (11%) and pre-tax earnings of $485 million in 2005
increased $19 million (4%) as compared to 2004. Despite increases in selling prices, operating margins in 2005 were adversely
affected by repeated increases in petroleum-based raw material costs. Consequently, increases in production costs outpaced
increases in selling prices. In addition, product sample costs pertaining to the introduction of new products increased
approximately $29 million in 2005 as compared to 2004.
Other manufacturing
Berkshire’s other manufacturing businesses include a wide array of businesses. Included in this group are several
manufacturers of building products (Acme Building Brands, Benjamin Moore, Johns Manville and MiTek) and apparel (Fruit of
the Loom, Garan, Russell Corporation, Fechheimers, Justin Brands and the H.H. Brown Shoe Group). Also included in this
group are Forest River, a leading manufacturer of leisure vehicles that was acquired on August 31, 2005 and the Iscar
Metalworking Companies (“IMC”), an industry leader in the metal cutting tools business with operations worldwide that was
acquired on July 5, 2006. Additionally, there are numerous other manufacturers of consumer and commercial products in this
diverse group.