Berkshire Hathaway 2006 Annual Report Download - page 39
Download and view the complete annual report
Please find page 39 of the 2006 Berkshire Hathaway annual report below. You can navigate through the pages in the report by either clicking on the pages listed below, or by using the keyword search tool below to find specific information within the annual report.-
 1
1 -
2
-
3
-
4
-
5
-
6
-
7
-
8
-
9
-
10
-
11
-
12
-
13
-
14
-
15
-
16
-
17
-
18
-
19
-
20
-
21
-
22
-
23
-
24
-
25
-
26
-
27
-
28
-
 29
29 -
 30
30 -
 31
31 -
 32
32 -
 33
33 -
 34
34 -
 35
35 -
 36
36 -
 37
37 -
 38
38 -
 39
39 -
 40
40 -
 41
41 -
 42
42 -
 43
43 -
 44
44 -
 45
45 -
 46
46 -
 47
47 -
 48
48 -
 49
49 -
50
-
51
-
52
-
53
-
54
-
55
-
56
-
57
-
58
-
59
-
60
-
61
-
62
-
63
-
64
-
65
-
66
-
67
-
68
-
69
-
70
-
71
-
72
-
73
-
74
-
75
-
76
-
77
-
78
-
79
-
80
-
81
-
82
 |
 |

38
Notes to Consolidated Financial Statements (Continued)
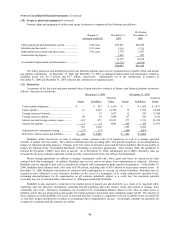
(5) Investments in fixed maturity securities
Investments in securities with fixed maturities as of December 31, 2006 and 2005 are shown below (in millions).
A
mortized Unrealized Unrealized Fai
r
Cost Gains
L
osse
s
* Value
December 31, 2006
Insurance and other:
U.S. Treasury, U.S. government corporations and agencies ........... $ 4,962 $ 12 $ (14) $ 4,960
States, municipalities and political subdivisions ............................. 2,967 71 (15) 3,023
Foreign governments ....................................................................... 8,444 51 (79) 8,416
Corporate bonds and redeemable preferred stocks.......................... 5,468 1,467 (17) 6,918
Mortgage-backed securities ............................................................. 1,955 35 (7) 1,983
$23,796 $1,636 $ (132) $25,300
Finance and financial products:
Corporate bonds............................................................................... $ 305 $ 70 $ — $ 375
Mortgage-backed securities ............................................................. 1,134 32 (4) 1,162
$ 1,439 $ 102 $ (4) $ 1,537
Mortgage-backed securities, held-to-maturity................................. $ 1,475 $ 153 $ (1) $ 1,627
* Includes gross unrealized losses of $69 million related to securities that have been in an unrealized loss position for 12 months or
more. Such losses are believed to be the result of general interest rate increases.
A
mortized Unrealized Unrealized Fai
r
Cost Gains
L
osses Value
December 31, 20
0
5
Insurance and other:
U.S. Treasury, U.S. government corporations and agencies ........... $ 7,660 $ 13 $ (28) $ 7,645
States, municipalities and political subdivisions ............................. 4,243 104 (14) 4,333
Foreign governments ....................................................................... 6,884 105 (28) 6,961
Corporate bonds and redeemable preferred stocks.......................... 5,492 1,492 (15) 6,969
Mortgage-backed securities ............................................................. 1,472 45 (5) 1,512
$25,751 $1,759 $ (90) $27,420
Finance and financial products:
U.S. Treasury and foreign governments .......................................... $ 114 $ — $ — $ 114
Corporate bonds............................................................................... 348 62 — 410
Mortgage-backed securities ............................................................. 1,425 44 (2) 1,467
$ 1,887 $ 106 $ (2) $ 1,991
Mortgage-backed securities, held-to-maturity................................. $ 1,444 $ 181 $ (1) $ 1,624
The amortized cost and estimated fair values of securities with fixed maturities at December 31, 2006 are summarized below by
contractual maturity dates. Actual maturities will differ from contractual maturities because issuers of certain of the securities retain
early call or prepayment rights. Amounts are in millions.
Mortgage-backed
Due 2007 Due 2008 – 2011 Due 2012 – 2016 Due after 2016 securities Total
Amortized cost ...... $8,314 $9,099 $2,575 $2,158 $4,564 $26,710
Fair value............... 8,493 9,531 2,713 2,955 4,772 28,464
(6) Investments in equity securities
Investments in equity securities are summarized below. Amounts are in millions.
December 31, December 31,
2006 2005
Cost............................................................................................................................................................ $28,353 $21,339
Gross unrealized gains .............................................................................................................................. 33,217 25,892
Gross unrealized losses ............................................................................................................................. (37) (510)
Fair value................................................................................................................................................... $61,533 $46,721