AutoZone 2013 Annual Report Download - page 92
Download and view the complete annual report
Please find page 92 of the 2013 AutoZone annual report below. You can navigate through the pages in the report by either clicking on the pages listed below, or by using the keyword search tool below to find specific information within the annual report.-
 1
1 -
2
-
3
-
4
-
5
-
6
-
7
-
8
-
9
-
10
-
11
-
12
-
13
-
14
-
15
-
16
-
17
-
18
-
19
-
20
-
21
-
22
-
23
-
24
-
25
-
26
-
27
-
28
-
29
-
30
-
31
-
32
-
33
-
34
-
35
-
36
-
37
-
38
-
39
-
40
-
41
-
42
-
43
-
44
-
45
-
46
-
47
-
48
-
49
-
50
-
51
-
52
-
53
-
54
-
55
-
56
-
57
-
58
-
59
-
60
-
61
-
62
-
63
-
64
-
65
-
66
-
67
-
68
-
69
-
70
-
71
-
72
-
73
-
74
-
75
-
76
-
77
-
78
-
79
-
80
-
81
-
 82
82 -
 83
83 -
 84
84 -
 85
85 -
 86
86 -
 87
87 -
 88
88 -
 89
89 -
 90
90 -
 91
91 -
 92
92 -
 93
93 -
 94
94 -
 95
95 -
 96
96 -
 97
97 -
 98
98 -
 99
99 -
 100
100 -
 101
101 -
 102
102 -
103
-
104
-
105
-
106
-
107
-
108
-
109
-
110
-
111
-
112
-
113
-
114
-
115
-
116
-
117
-
118
-
119
-
120
-
121
-
122
-
123
-
124
-
125
-
126
-
127
-
128
-
129
-
130
-
131
-
132
-
133
-
134
-
135
-
136
-
137
-
138
-
139
-
140
-
141
-
142
-
143
-
144
-
145
-
146
-
147
-
148
-
149
-
150
-
151
-
152
 |
 |

30
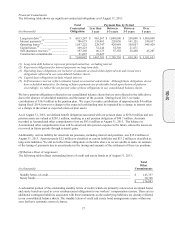
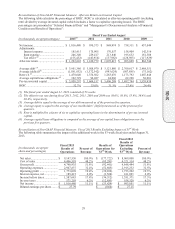
Reconciliation of Non-GAAP Financial Measure: Adjusted Debt to EBITDAR
The following table calculates the ratio of adjusted debt to EBITDAR. Adjusted debt to EBITDAR is calculated as
the sum of total debt, capital lease obligations and annual rents times six; divided by net income plus interest,
taxes, depreciation, amortization, rent and share-based compensation expense. The adjusted debt to EBITDAR
ratios are presented in “Selected Financial Data” and “Management’s Discussion and Analysis of Financial
Condition and Results of Operations”:
Fiscal Year Ended August
(in thousands, except ratio
s
) 2013
(1)
2012 2011 2010 2009
N
et income ......................................... $ 1,016,480 $ 930,373 $ 848,974 $ 738,311 $ 657,049
Add: Interest expense ....................... 185,415 175,905 170,557 158,909 142,316
Income tax expense ................. 571,203 522,613 475,272 422,194 376,697
EBIT .................................................. 1,773,098 1,628,891 1,494,803 1,319,414 1,176,062
Add: Depreciation expense .............. 227,251 211,831 196,209 192,084 180,433
Rent expense ........................... 246,340 229,417 213,846 195,632 181,308
Share-
b
ased expense ............... 37,307 33,363 26,625 19,120 19,135
EBITDAR .......................................... $ 2,283,996 $ 2,103,502 $ 1,931,483 $ 1,726,250 $ 1,556,938
Deb
t
................................................... $ 4,187,000 $ 3,768,183 $ 3,351,682 $ 2,908,486 $ 2,726,900
Capital lease obligations .................... 106,171 102,256 86,656 88,280 54,764
Rent x 6 .............................................. 1,478,040 1,376,502 1,283,076 1,173,792 1,087,848
Adjusted deb
t
..................................... $ 5,771,211 $ 5,246,941 $ 4,721,414 $ 4,170,558 $ 3,869,512
Adjusted debt to EBITDAR ............... 2.5 2.5 2.4 2.4 2.5
(1) The fiscal year ended August 31, 2013 consisted of 53 weeks.
Recent Accounting Pronouncements
See Note A of the Notes to Consolidated Financial Statements for a discussion on recent accounting
pronouncements.
Critical Accounting Policies and Estimates
Preparation of our consolidated financial statements requires us to make estimates and assumptions affecting the
reported amounts of assets and liabilities at the date of the financial statements, reported amounts of revenues and
expenses during the reporting period and related disclosures of contingent liabilities. In the notes to our
consolidated financial statements, we describe our significant accounting policies used in preparing the
consolidated financial statements. Our policies are evaluated on an ongoing basis and are drawn from historical
experience and other assumptions that we believe to be reasonable under the circumstances. Actual results could
differ under different assumptions or conditions. Our senior management has identified the critical accounting
policies for the areas that are materially impacted by estimates and assumptions and have discussed such policies
with the Audit Committee of our Board. The following items in our consolidated financial statements represent
our critical accounting policies that require significant estimation or judgment by management:
Inventory Reserves and Cost of Sales
LIFO
We state our inventories at the lower of cost or market using the last-in, first-out (“LIFO”) method for domestic
merchandise and the first-in, first out (“FIFO”) method for Mexico inventories. Due to price deflation on our
merchandise purchases, our domestic inventory balances are effectively maintained under the FIFO method. We
do not write up inventory for favorable LIFO adjustments, and due to price deflation, LIFO costs of our domestic
inventories exceed replacement costs by $283.7 million at August 31, 2013, calculated using the dollar value
method.
10-K