AutoZone 2013 Annual Report Download - page 83
Download and view the complete annual report
Please find page 83 of the 2013 AutoZone annual report below. You can navigate through the pages in the report by either clicking on the pages listed below, or by using the keyword search tool below to find specific information within the annual report.-
 1
1 -
2
-
3
-
4
-
5
-
6
-
7
-
8
-
9
-
10
-
11
-
12
-
13
-
14
-
15
-
16
-
17
-
18
-
19
-
20
-
21
-
22
-
23
-
24
-
25
-
26
-
27
-
28
-
29
-
30
-
31
-
32
-
33
-
34
-
35
-
36
-
37
-
38
-
39
-
40
-
41
-
42
-
43
-
44
-
45
-
46
-
47
-
48
-
49
-
50
-
51
-
52
-
53
-
54
-
55
-
56
-
57
-
58
-
59
-
60
-
61
-
62
-
63
-
64
-
65
-
66
-
67
-
68
-
69
-
70
-
71
-
72
-
 73
73 -
 74
74 -
 75
75 -
 76
76 -
 77
77 -
 78
78 -
 79
79 -
 80
80 -
 81
81 -
 82
82 -
 83
83 -
 84
84 -
 85
85 -
 86
86 -
 87
87 -
 88
88 -
 89
89 -
 90
90 -
 91
91 -
 92
92 -
 93
93 -
94
-
95
-
96
-
97
-
98
-
99
-
100
-
101
-
102
-
103
-
104
-
105
-
106
-
107
-
108
-
109
-
110
-
111
-
112
-
113
-
114
-
115
-
116
-
117
-
118
-
119
-
120
-
121
-
122
-
123
-
124
-
125
-
126
-
127
-
128
-
129
-
130
-
131
-
132
-
133
-
134
-
135
-
136
-
137
-
138
-
139
-
140
-
141
-
142
-
143
-
144
-
145
-
146
-
147
-
148
-
149
-
150
-
151
-
152
 |
 |

21
we have not experienced any fundamental shifts in our category sales mix as compared to previous years, we did
experience a slight decline in sales of the maintenance category as a percentage of sales. We believe the slowdown
in maintenance related products during fiscal 2013 was largely due to weather related impacts in various regions.
Because of the unusually mild winter during fiscal 2012 across parts of the U.S., we saw a reduced benefit from
sales of maintenance related products in fiscal 2013 compared to the prior fiscal year. However, sales in the
maintenance category did improve in the last quarter of fiscal 2013 due to a more normalized winter in fiscal 2013
as compared to fiscal 2012.
Our primary response to fluctuations in the demand for the products we sell is to adjust our advertising message,
store staffing, and product assortment. Specifically, during fiscal 2013, we have closely studied our hub
distribution model and store inventory levels and assortment. As a result, we are performing certain strategic tests
including adding additional inventory into our hub stores and increasing product availability in our stores. We
continue to believe we are well positioned to help our customers save money and meet their needs in a
challenging macroeconomic environment.
The two statistics we believe have the closest correlation to our market growth over the long-term are miles driven
and the number of seven year old or older vehicles on the road.
Miles Driven
We believe that as the number of miles driven increases, consumers’ vehicles are more likely to need service and
maintenance, resulting in an increase in the need for automotive hard parts and maintenance items. While over the
long-term, we have seen a close correlation between our net sales and the number of miles driven, we have also
seen certain time frames of minimal correlation in sales performance and miles driven. During the periods of
minimal correlation between net sales and miles driven, we believe net sales have been positively impacted by
other factors, including the number of seven year old or older vehicles on the road. Since the beginning of the
fiscal year and through June 2013 (latest publicly available information), miles driven decreased slightly
compared to the same period last year.
Seven Year Old or Older Vehicles
Since 2008, new vehicle sales have been significantly lower than historical levels, which we believe contributed to
an increasing number of seven year old or older vehicles on the road. We estimate vehicles are driven an average
of approximately 12,500 miles each year. In seven years, the average miles driven equates to approximately
87,500 miles. Our experience is that at this point in a vehicle’s life, most vehicles are not covered by warranties
and increased maintenance is needed to keep the vehicle operating. According to the latest data provided by the
Automotive Aftermarket Industry Association, as of January 1, 2013, the average age of vehicles on the road is
11.3 years as compared to 11.1 years as of January 1, 2012. Although the average age of vehicles continues to
increase, it is increasing at a decelerated rate primarily driven by the improvement in new car sales in recent years.
However, in the near term, we expect the aging vehicle population to continue to increase, as consumers keep
their cars longer in an effort to save money during this uncertain economy. As the number of seven year old or
older vehicles on the road increases, we expect an increase in demand for the products we sell.
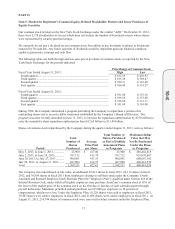
Results of Operations
Fiscal 2013 Compared with Fiscal 2012
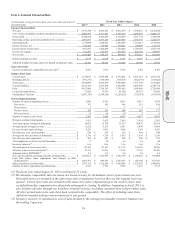
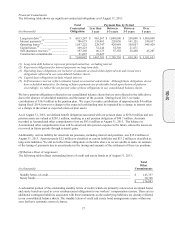
For the fiscal year ended August 31, 2013, we reported net sales of $9.148 billion compared with $8.604 billion
for the year ended August 25, 2012, a 6.3% increase from fiscal 2012. This growth was driven primarily by sales
from new stores of $222.3 million, the 53rd week sales of $177.7 million, and sales from AutoAnything for a
portion of the fiscal year.
At August 31, 2013, we operated 4,836 domestic stores, 362 stores in Mexico and three stores in Brazil, compared
with 4,685 domestic stores, 321 stores in Mexico and none in Brazil at August 25, 2012. We reported a total auto
parts (domestic, Mexico and Brazil) sales increase of 5.2% for fiscal 2013.
Gross profit for fiscal 2013 was $4.741 billion, or 51.8% of net sales, compared with $4.432 billion, or 51.5% of
net sales for fiscal 2012. The improvement in gross margin was primarily driven by lower product acquisition
costs, partially offset by the inclusion of AutoAnything (28 basis points).
10-K