AutoZone 2013 Annual Report Download - page 102
Download and view the complete annual report
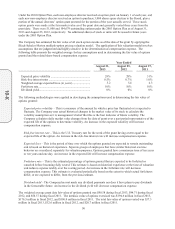
Please find page 102 of the 2013 AutoZone annual report below. You can navigate through the pages in the report by either clicking on the pages listed below, or by using the keyword search tool below to find specific information within the annual report.-
 1
1 -
2
-
3
-
4
-
5
-
6
-
7
-
8
-
9
-
10
-
11
-
12
-
13
-
14
-
15
-
16
-
17
-
18
-
19
-
20
-
21
-
22
-
23
-
24
-
25
-
26
-
27
-
28
-
29
-
30
-
31
-
32
-
33
-
34
-
35
-
36
-
37
-
38
-
39
-
40
-
41
-
42
-
43
-
44
-
45
-
46
-
47
-
48
-
49
-
50
-
51
-
52
-
53
-
54
-
55
-
56
-
57
-
58
-
59
-
60
-
61
-
62
-
63
-
64
-
65
-
66
-
67
-
68
-
69
-
70
-
71
-
72
-
73
-
74
-
75
-
76
-
77
-
78
-
79
-
80
-
81
-
82
-
83
-
84
-
85
-
86
-
87
-
88
-
89
-
90
-
91
-
 92
92 -
 93
93 -
 94
94 -
 95
95 -
 96
96 -
 97
97 -
 98
98 -
 99
99 -
 100
100 -
 101
101 -
 102
102 -
 103
103 -
 104
104 -
 105
105 -
 106
106 -
 107
107 -
 108
108 -
 109
109 -
 110
110 -
 111
111 -
 112
112 -
113
-
114
-
115
-
116
-
117
-
118
-
119
-
120
-
121
-
122
-
123
-
124
-
125
-
126
-
127
-
128
-
129
-
130
-
131
-
132
-
133
-
134
-
135
-
136
-
137
-
138
-
139
-
140
-
141
-
142
-
143
-
144
-
145
-
146
-
147
-
148
-
149
-
150
-
151
-
152
 |
 |

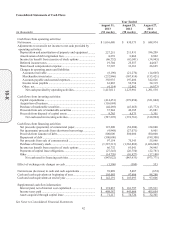
40
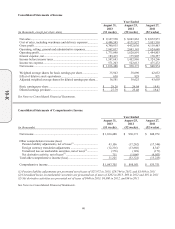
Consolidated Statements of Income
Year Ended
(in thousands, except per share data)
August 31,
2013
(53 weeks)
August 25,
2012
(52 weeks)
August 27,
2011
(52 weeks)
Net sales .......................................................................................... $ 9,147,530 $ 8,603,863 $ 8,072,973
Cost of sales, including warehouse and delivery expenses ............. 4,406,595 4,171,827 3,953,510
Gross profi
t
..................................................................................... 4,740,935 4,432,036 4,119,463
Operating, selling, general and administrative expenses ................. 2,967,837 2,803,145 2,624,660
Operating profit ............................................................................... 1,773,098 1,628,891 1,494,803
Interest expense, net ........................................................................ 185,415 175,905 170,557
Income before income taxes............................................................ 1,587,683 1,452,986 1,324,246
Income tax expense ......................................................................... 571,203 522,613 475,272
Net income ...................................................................................... $ 1,016,480 $ 930,373 $ 848,974
Weighted average shares for basic earnings per share .................... 35,943 38,696 42,632
Effect of dilutive stock equivalents ................................................. 638 929 971
Adjusted weighted average shares for diluted earnings per share ... 36,581 39,625 43,603
Basic earnings per share .................................................................. $ 28.28 $ 24.04 $ 19.91
Diluted earnings per share ............................................................... $ 27.79 $ 23.48 $ 19.47
See Notes to Consolidated Financial Statements.
Consolidated Statements of Comprehensive Income
Year Ended
(in thousands)
August 31,
2013
(53 weeks)
August 25,
2012
(52 weeks)
August 27,
2011
(52 weeks)
Net income ...................................................................................... $ 1,016,480 $ 930,373 $ 848,974
Other comprehensive income (loss):
Pension liability adjustments, net of taxes
(1)
................................ 43,106 (17,262) (17,346)
Foreign currency translation adjustments .................................... (12,216) (13,866) 8,347
Unrealized loss on marketable securities, net of taxes(2) .............. (376) (128) (171)
Net derivative activity, net of taxes(3) .......................................... 711 (1,066) (4,053)
Total other comprehensive income (loss) ....................................... 31,225 (32,322) (13,223)
Comprehensive income ................................................................... $ 1,047,705 $ 898,051 $ 835,751
(1) Pension liability adjustments are presented net of taxes of $27,972 in 2013, $29,744 in 2012, and $3,998 in 2011
(2) Unrealized losses on marketable securities are presented net of taxes of $202 in 2013, $69 in 2012 and $91 in 2011
(3) Net derivative activities are presented net of taxes of $440 in 2013, $4,800 in 2012, and $0 in 2011
See Notes to Consolidated Financial Statements.
10-K