AutoZone 2013 Annual Report Download - page 124
Download and view the complete annual report
Please find page 124 of the 2013 AutoZone annual report below. You can navigate through the pages in the report by either clicking on the pages listed below, or by using the keyword search tool below to find specific information within the annual report.-
 1
1 -
2
-
3
-
4
-
5
-
6
-
7
-
8
-
9
-
10
-
11
-
12
-
13
-
14
-
15
-
16
-
17
-
18
-
19
-
20
-
21
-
22
-
23
-
24
-
25
-
26
-
27
-
28
-
29
-
30
-
31
-
32
-
33
-
34
-
35
-
36
-
37
-
38
-
39
-
40
-
41
-
42
-
43
-
44
-
45
-
46
-
47
-
48
-
49
-
50
-
51
-
52
-
53
-
54
-
55
-
56
-
57
-
58
-
59
-
60
-
61
-
62
-
63
-
64
-
65
-
66
-
67
-
68
-
69
-
70
-
71
-
72
-
73
-
74
-
75
-
76
-
77
-
78
-
79
-
80
-
81
-
82
-
83
-
84
-
85
-
86
-
87
-
88
-
89
-
90
-
91
-
92
-
93
-
94
-
95
-
96
-
97
-
98
-
99
-
100
-
101
-
102
-
103
-
104
-
105
-
106
-
107
-
108
-
109
-
110
-
111
-
112
-
113
-
 114
114 -
 115
115 -
 116
116 -
 117
117 -
 118
118 -
 119
119 -
 120
120 -
 121
121 -
 122
122 -
 123
123 -
 124
124 -
 125
125 -
 126
126 -
 127
127 -
 128
128 -
 129
129 -
 130
130 -
 131
131 -
 132
132 -
 133
133 -
 134
134 -
135
-
136
-
137
-
138
-
139
-
140
-
141
-
142
-
143
-
144
-
145
-
146
-
147
-
148
-
149
-
150
-
151
-
152
 |
 |
62
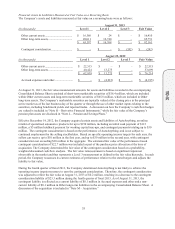
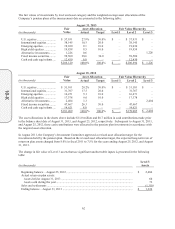
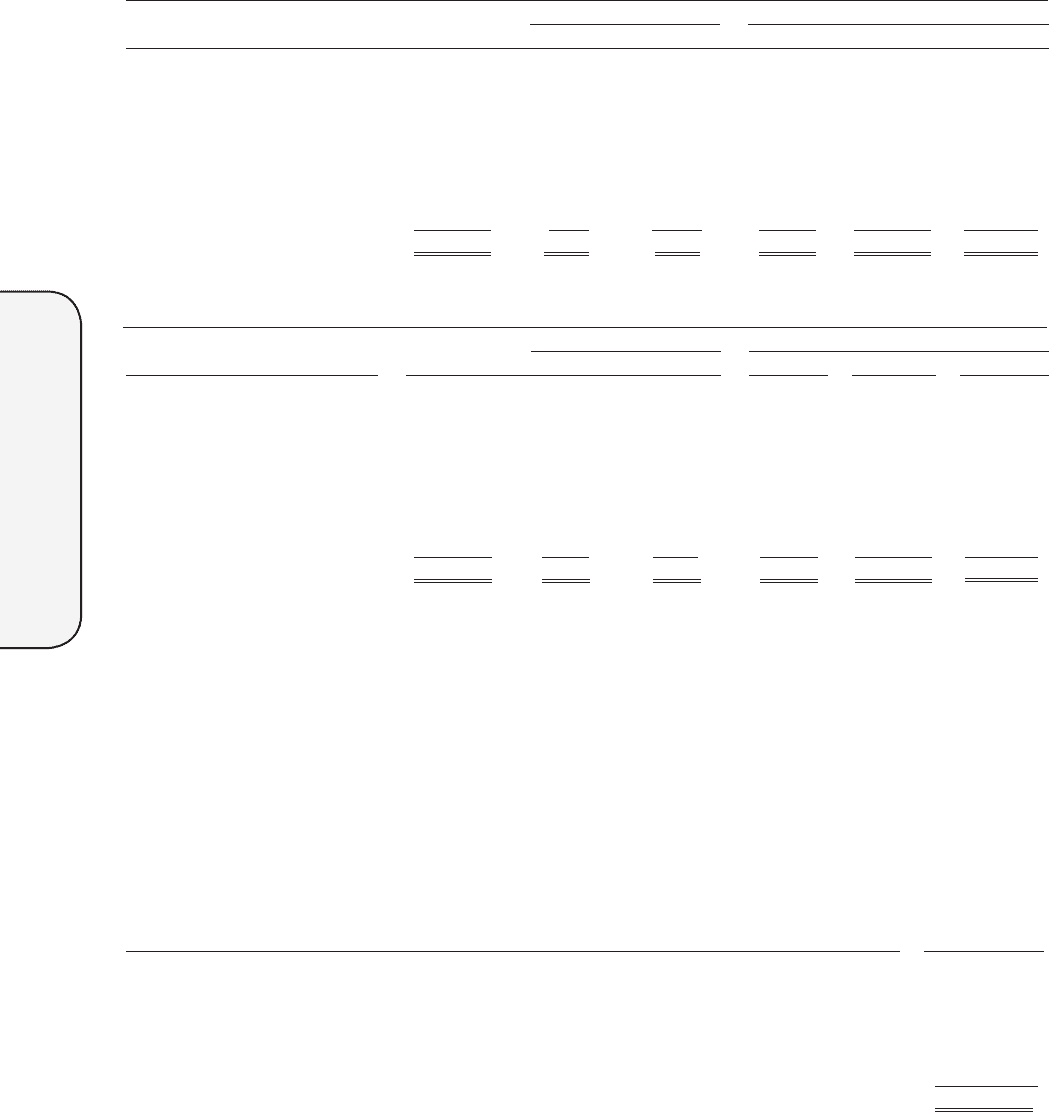
The fair values of investments by level and asset category and the weighted-average asset allocations of the
Company’s pension plans at the measurement date are presented in the following table:
August 31, 2013
Fair
Value
Asset Allocation Fair Value Hierarchy
(in thousands) Actual Target
Level 1 Level 2 Level 3
U.S. equities .........................
.
$ 57,931 27.9% 30.0% $ – $ 57,931 $ –
International equities ............
.
38,145 18.3 20.0 – 38,145 –
Emerging equities ................
.
19,030 9.1 10.0 – 19,030 –
High yield equities ...............
.
19,858 9.5 10.0 – 19,858 –
Alternative investments ........
.
1,226 0.6 – – – 1,226
Fixed income securities ........
.
59,500 28.6 30.0 – 59,500
–
Cash and cash equivalents ....
.
12,430 6.0 – – 12,430 –
$ 208,120 100.0%100.0% $ – $ 206,894 $ 1,226
August 25, 2012
Fair
Value
Asset Allocation Fair Value Hierarchy
(in thousands) Actual Target
Level 1 Level 2 Level 3
U.S. equities .........................
.
$ 51,101 28.2% 30.0% $ – $ 51,101 $ –
International equities ............
.
31,767 17.5 20.0 – 31,767 –
Emerging equities ................
.
16,471 9.1 10.0 – 16,471 –
High yield equities ...............
.
17,378 9.6 10.0 – 17,378 –
Alternative investments ........
.
2,404 1.3 – – –
2,404
Fixed income securities ........
.
47,667 26.3 30.0 – 47,667 –
Cash and cash equivalents ....
.
14,621 8.0 – – 14,621 –
$ 181,409 100.0% 100.0% $ – $ 179,005 $2,404
The asset allocations in the charts above include $11.0 million and $8.7 million in cash contributions made prior
to the balance sheet date of August 31, 2013, and August 25, 2012, respectively. Subsequent to August 31, 2013,
and August 25, 2012, these cash contributions were allocated to the pension plan investments in accordance with
the targeted asset allocation.
In August 2011, the Company’s Investment Committee approved a revised asset allocation target for the
investments held by the pension plan. Based on the revised asset allocation target, the expected long-term rate of
return on plan assets changed from 8.0% in fiscal 2011 to 7.5% for the years ending August 25, 2012, and August
31, 2013.
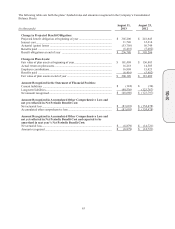
The change in fair value of Level 3 assets that use significant unobservable inputs is presented in the following
table:
(in thousands)
Level 3
Assets
Beginning balance
–
August 25, 2012 ......................................................................................... $ 2,404
Actual return on plan assets:
Assets held at August 31, 2013 ................................................................................................ 60
Assets sold during the yea
r
....................................................................................................... 72
Sales and settlements ................................................................................................................... (1,310)
Ending balance
–
August 31, 2013 .............................................................................................. $ 1,226
10-K