AutoZone 2013 Annual Report Download - page 80
Download and view the complete annual report
Please find page 80 of the 2013 AutoZone annual report below. You can navigate through the pages in the report by either clicking on the pages listed below, or by using the keyword search tool below to find specific information within the annual report.-
 1
1 -
2
-
3
-
4
-
5
-
6
-
7
-
8
-
9
-
10
-
11
-
12
-
13
-
14
-
15
-
16
-
17
-
18
-
19
-
20
-
21
-
22
-
23
-
24
-
25
-
26
-
27
-
28
-
29
-
30
-
31
-
32
-
33
-
34
-
35
-
36
-
37
-
38
-
39
-
40
-
41
-
42
-
43
-
44
-
45
-
46
-
47
-
48
-
49
-
50
-
51
-
52
-
53
-
54
-
55
-
56
-
57
-
58
-
59
-
60
-
61
-
62
-
63
-
64
-
65
-
66
-
67
-
68
-
69
-
 70
70 -
 71
71 -
 72
72 -
 73
73 -
 74
74 -
 75
75 -
 76
76 -
 77
77 -
 78
78 -
 79
79 -
 80
80 -
 81
81 -
 82
82 -
 83
83 -
 84
84 -
 85
85 -
 86
86 -
 87
87 -
 88
88 -
 89
89 -
 90
90 -
91
-
92
-
93
-
94
-
95
-
96
-
97
-
98
-
99
-
100
-
101
-
102
-
103
-
104
-
105
-
106
-
107
-
108
-
109
-
110
-
111
-
112
-
113
-
114
-
115
-
116
-
117
-
118
-
119
-
120
-
121
-
122
-
123
-
124
-
125
-
126
-
127
-
128
-
129
-
130
-
131
-
132
-
133
-
134
-
135
-
136
-
137
-
138
-
139
-
140
-
141
-
142
-
143
-
144
-
145
-
146
-
147
-
148
-
149
-
150
-
151
-
152
 |
 |
18
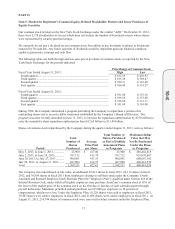
Once executives have reached the maximum purchases under the Employee Plan, the Fifth Amended and Restated
Executive Stock Purchase Plan (the “Executive Plan”) permits all eligible executives to purchase AutoZone’s
common stock up to 25 percent of his or her annual salary and bonus. Purchases by executives under the
Executive Plan were 3,454 shares in fiscal 2013, 3,937 shares in fiscal 2012, and 1,719 shares in fiscal 2011. At
August 31, 2013, 248,953 shares of common stock were reserved for future issuance under the Executive Plan.
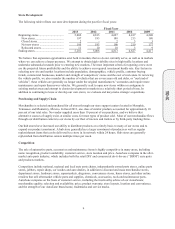
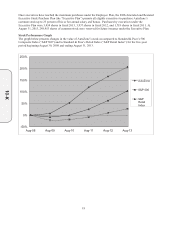
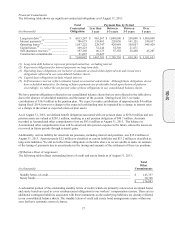
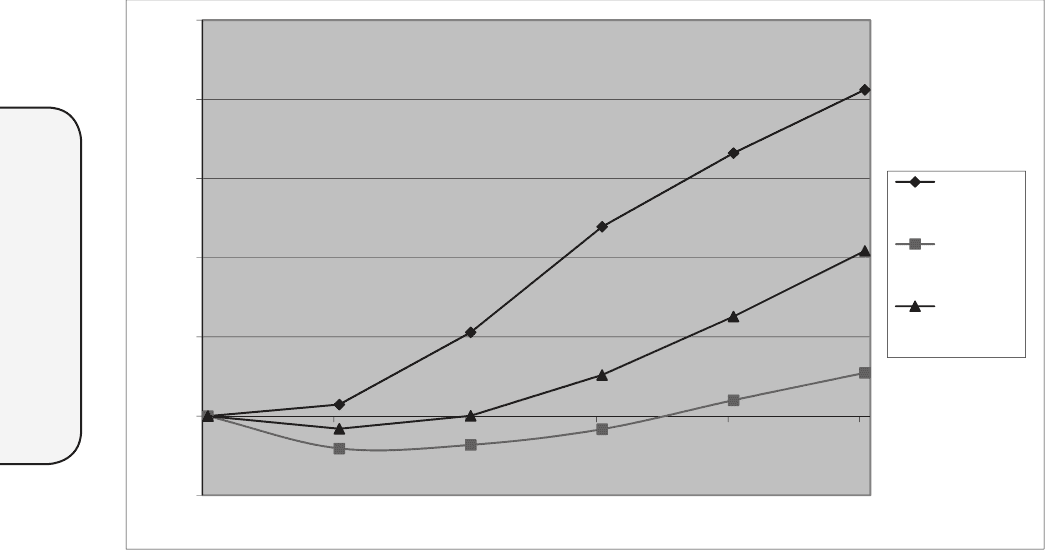
Stock Performance Graph
The graph below presents changes in the value of AutoZone’s stock as compared to Standard & Poor’s 500
Composite Index (“S&P 500”) and to Standard & Poor’s Retail Index (“S&P Retail Index”) for the five-year
period beginning August 30, 2008 and ending August 31, 2013.
-50%
0%
50%
100%
150%
200%
250%
Aug-08 Aug-09 Aug-10 Aug-11 Aug-12 Aug-13
AutoZone
S&P 500
S&P
Retail
Index
10-K