AutoZone 2013 Annual Report Download - page 91
Download and view the complete annual report
Please find page 91 of the 2013 AutoZone annual report below. You can navigate through the pages in the report by either clicking on the pages listed below, or by using the keyword search tool below to find specific information within the annual report.-
 1
1 -
2
-
3
-
4
-
5
-
6
-
7
-
8
-
9
-
10
-
11
-
12
-
13
-
14
-
15
-
16
-
17
-
18
-
19
-
20
-
21
-
22
-
23
-
24
-
25
-
26
-
27
-
28
-
29
-
30
-
31
-
32
-
33
-
34
-
35
-
36
-
37
-
38
-
39
-
40
-
41
-
42
-
43
-
44
-
45
-
46
-
47
-
48
-
49
-
50
-
51
-
52
-
53
-
54
-
55
-
56
-
57
-
58
-
59
-
60
-
61
-
62
-
63
-
64
-
65
-
66
-
67
-
68
-
69
-
70
-
71
-
72
-
73
-
74
-
75
-
76
-
77
-
78
-
79
-
80
-
 81
81 -
 82
82 -
 83
83 -
 84
84 -
 85
85 -
 86
86 -
 87
87 -
 88
88 -
 89
89 -
 90
90 -
 91
91 -
 92
92 -
 93
93 -
 94
94 -
 95
95 -
 96
96 -
 97
97 -
 98
98 -
 99
99 -
 100
100 -
 101
101 -
102
-
103
-
104
-
105
-
106
-
107
-
108
-
109
-
110
-
111
-
112
-
113
-
114
-
115
-
116
-
117
-
118
-
119
-
120
-
121
-
122
-
123
-
124
-
125
-
126
-
127
-
128
-
129
-
130
-
131
-
132
-
133
-
134
-
135
-
136
-
137
-
138
-
139
-
140
-
141
-
142
-
143
-
144
-
145
-
146
-
147
-
148
-
149
-
150
-
151
-
152
 |
 |

29
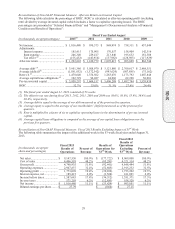
Reconciliation of Non-GAAP Financial Measure: After-tax Return on Invested Capital
The following table calculates the percentage of ROIC. ROIC is calculated as after-tax operating profit (excluding
rent) divided by average invested capital (which includes a factor to capitalize operating leases). The ROIC
percentages are presented in “Selected Financial Data” and “Management’s Discussion and Analysis of Financial
Condition and Results of Operations”:
Fiscal Year Ended August
(in thousands, except percentage
s
) 2013
(1)
2012 2011 2010 2009
N
et income .......................................... $ 1,016,480 $ 930,373 $ 848,974 $ 738,311 $ 657,049
Adjustments:
Interest expense ............................ 185,415 175,905 170,557 158,909 142,316
Rent expense ................................. 246,340 229,417 213,846 195,632 181,308
Tax effect
(2)
.................................. (155,432) (145,916) (137,962) (128,983) (117,929)
Afte
r
-tax return ................................... $ 1,292,803 $ 1,189,779 $ 1,095,415 $963,869 $ 862,744
Avera
g
e debt
(3)
................................... $ 3,951,360 $ 3,508,970 $ 3,121,880 $ 2,769,617 $ 2,468,351
Average (deficit)
(4)
.............................. (1,581,832) (1,372,342) (993,624) (507,885) (75,162)
Rent x 6
(5)
........................................... 1,478,040 1,376,502 1,283,076 1,173,792 1,087,848
Avera
g
e capital lease obli
g
ations
(6)
.. 102,729 96,027 84,966 62,220 58,901
Pre-tax invested capital ....................... $ 3,950,297 $ 3,609,157 $ 3,496,298 $ 3,497,744 $ 3,539,938
ROIC ................................................... 32.7% 33.0% 31.3% 27.6% 24.4%
(1) The fiscal year ended August 31, 2013 consisted of 53 weeks.
(2) The effective tax rate during fiscal 2013, 2012, 2011, 2010 and 2009 was 36.0%, 36.0%, 35.9%, 36.4% and
36.4%, respectively.
(3) Average debt is equal to the average of our debt measured as of the previous five quarters.
(4) Average equity is equal to the average of our stockholders’ (deficit) measured as of the previous five
quarters.
(5) Rent is multiplied by a factor of six to capitalize operating leases in the determination of pre-tax invested
capital.
(6) Average capital lease obligations is computed as the average of our capital lease obligations over the
previous five quarters.
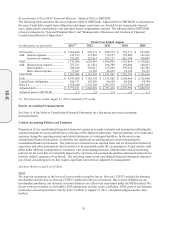
Reconciliation of Non-GAAP Financial Measure: Fiscal 2013 Results Excluding Impact of 53rd Week:
The following table summarizes the impact of the additional week to the 53 week fiscal year ended August 31,
2013.
(in thousands, except per
share and percentages)
Fiscal 2013
Results of
O
p
erations
Percent of
Revenue
Results of
Operations for
53rd Wee
k
Fiscal 2013
Results of
Operations
Excluding
53rd Wee
k
Percent of
Revenue
N
et sales ...................................
.
$ 9,147,530 100.0% $ (177,722) $ 8,969,808 100.0%
Cost of sales .............................
.
4,406,595 48.2% (85,281) 4,321,314 48.2%
Gross profi
t
..............................
.
4,740,935 51.8% (92,441) 4,648,494 51.8%
Operating expenses ..................
.
2,967,837 32.4% (52,605) 2,915,232 32.5%
Operating profit .......................
.
1,773,098 19.4% (39,836) 1,733,262 19.3%
Interest expense, ne
t
.................
.
185,415 2.0% (3,524)181,891 2.0%
Income before taxes .................
.
1,587,683 17.4% (36,312) 1,551,371 17.3%
Income taxes ............................
.
571,203 6.2% (12,883)558,320 6.2%
N
et income ...............................
.
$ 1,016,480 11.1% $(23,429) $ 993,051 11.1%
Diluted earnings per share .......
.
$ 27.79 $ (0.64)$ 27.15
10-K