AutoZone 2013 Annual Report Download - page 85
Download and view the complete annual report
Please find page 85 of the 2013 AutoZone annual report below. You can navigate through the pages in the report by either clicking on the pages listed below, or by using the keyword search tool below to find specific information within the annual report.-
 1
1 -
2
-
3
-
4
-
5
-
6
-
7
-
8
-
9
-
10
-
11
-
12
-
13
-
14
-
15
-
16
-
17
-
18
-
19
-
20
-
21
-
22
-
23
-
24
-
25
-
26
-
27
-
28
-
29
-
30
-
31
-
32
-
33
-
34
-
35
-
36
-
37
-
38
-
39
-
40
-
41
-
42
-
43
-
44
-
45
-
46
-
47
-
48
-
49
-
50
-
51
-
52
-
53
-
54
-
55
-
56
-
57
-
58
-
59
-
60
-
61
-
62
-
63
-
64
-
65
-
66
-
67
-
68
-
69
-
70
-
71
-
72
-
73
-
74
-
 75
75 -
 76
76 -
 77
77 -
 78
78 -
 79
79 -
 80
80 -
 81
81 -
 82
82 -
 83
83 -
 84
84 -
 85
85 -
 86
86 -
 87
87 -
 88
88 -
 89
89 -
 90
90 -
 91
91 -
 92
92 -
 93
93 -
 94
94 -
 95
95 -
96
-
97
-
98
-
99
-
100
-
101
-
102
-
103
-
104
-
105
-
106
-
107
-
108
-
109
-
110
-
111
-
112
-
113
-
114
-
115
-
116
-
117
-
118
-
119
-
120
-
121
-
122
-
123
-
124
-
125
-
126
-
127
-
128
-
129
-
130
-
131
-
132
-
133
-
134
-
135
-
136
-
137
-
138
-
139
-
140
-
141
-
142
-
143
-
144
-
145
-
146
-
147
-
148
-
149
-
150
-
151
-
152
 |
 |

23
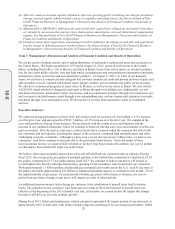
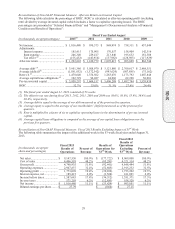
Gross profit for fiscal 2012 was $4.432 billion, or 51.5% of net sales, compared with $4.119 billion, or 51.0% of
net sales for fiscal 2011. The improvement in gross margin was primarily attributable to higher merchandise
margins (19 basis points) and lower shrink expense (17 basis points). Lower acquisition costs drove the higher
merchandise margins for the year.
Operating, selling, general and administrative expenses for fiscal 2012 increased to $2.803 billion, or 32.6% of net
sales, from $2.625 billion, or 32.5% of net sales for fiscal 2011. The slight increase in operating expenses, as a
percentage of sales, was the result of higher self-insurance costs (42 basis points); partially offset by lower
incentive compensation (30 basis points).
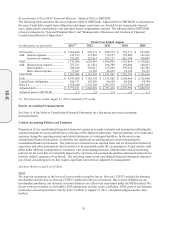
Interest expense, net for fiscal 2012 was $175.9 million compared with $170.6 million during fiscal 2011. This
increase was primarily due to higher average borrowing levels over the comparable prior year period; partially
offset by a decline in borrowing rates. Average borrowings for fiscal 2012 were $3.507 billion, compared with
$3.103 billion for fiscal 2011 and weighted average borrowing rates were 4.7% for fiscal 2012, compared to 5.1%
for fiscal 2011.
Our effective income tax rate was 36.0% of pre-tax income for fiscal 2012 compared to 35.9% for fiscal 2011.
Net income for fiscal 2012 increased by 9.6% to $930.4 million, and diluted earnings per share increased 20.6% to
$23.48 from $19.47 in fiscal 2011. The impact of the fiscal 2012 stock repurchases on diluted earnings per share
in fiscal 2012 was an increase of approximately $0.96.
Seasonality and Quarterly Periods
Our business is somewhat seasonal in nature, with the highest sales typically occurring in the spring and summer
months of February through September, in which average weekly per-store sales historically have been about 15%
to 25% higher than in the slower months of December and January. During short periods of time, a store’s sales
can be affected by weather conditions. Extremely hot or extremely cold weather may enhance sales by causing
parts to fail; thereby increasing sales of seasonal products. Mild or rainy weather tends to soften sales, as parts
failure rates are lower in mild weather, with elective maintenance deferred during periods of rainy weather. Over
the longer term, the effects of weather balance out, as we have stores throughout the United States, Puerto Rico,
Mexico and Brazil.
Each of the first three quarters of our fiscal year consists of 12 weeks, and the fourth quarter consisted of 17
weeks in 2013 and 16 weeks in 2012 and 2011. Because the fourth quarter contains seasonally high sales volume
and consists of 16 or 17 weeks, compared with 12 weeks for each of the first three quarters, our fourth quarter
represents a disproportionate share of the annual net sales and net income. The fourth quarter of fiscal year 2013
represented 33.8% of annual sales and 36.5% of net income; the fourth quarter of fiscal 2012 represented 32.1%
of annual sales and 34.8% of net income; and the fourth quarter of fiscal 2011 represented 32.7% of annual sales
and 35.5% of net income.
Liquidity and Capital Resources
The primary source of our liquidity is our cash flows realized through the sale of automotive parts and products.
Net cash provided by operating activities was $1.415 billion in fiscal 2013, $1.224 billion in fiscal 2012, and
$1.292 billion in fiscal 2011. Cash flows from operations are favorable to last year due to the change in
inventories net of payables and the growth in net income. We had an accounts payable to inventory ratio of
115.6% at August 31, 2013, 111.4% at August 25, 2012, and 111.7% at August 27, 2011. Our inventory increases
are primarily attributable to our efforts to update product assortments in all of our stores and an increased number
of stores. During fiscal 2013, we initiated a variety of strategic inventory tests focused on increasing inventory
availability, which increased our inventory per store. Many of our vendors have supported our initiative to update
our product assortments by providing extended payment terms. These extended payment terms have allowed us
to continue our high accounts payable to inventory ratio.
Our primary capital requirement has been the funding of our continued new-store development program. From the
beginning of fiscal 2011 to August 31, 2013, we have opened 578 new stores. Net cash flows used in investing
activities were $527.3 million in fiscal 2013, compared to $374.8 million in fiscal 2012, and $319.0 million in
10-K