AutoZone 2013 Annual Report Download - page 104
Download and view the complete annual report
Please find page 104 of the 2013 AutoZone annual report below. You can navigate through the pages in the report by either clicking on the pages listed below, or by using the keyword search tool below to find specific information within the annual report.-
 1
1 -
2
-
3
-
4
-
5
-
6
-
7
-
8
-
9
-
10
-
11
-
12
-
13
-
14
-
15
-
16
-
17
-
18
-
19
-
20
-
21
-
22
-
23
-
24
-
25
-
26
-
27
-
28
-
29
-
30
-
31
-
32
-
33
-
34
-
35
-
36
-
37
-
38
-
39
-
40
-
41
-
42
-
43
-
44
-
45
-
46
-
47
-
48
-
49
-
50
-
51
-
52
-
53
-
54
-
55
-
56
-
57
-
58
-
59
-
60
-
61
-
62
-
63
-
64
-
65
-
66
-
67
-
68
-
69
-
70
-
71
-
72
-
73
-
74
-
75
-
76
-
77
-
78
-
79
-
80
-
81
-
82
-
83
-
84
-
85
-
86
-
87
-
88
-
89
-
90
-
91
-
92
-
93
-
 94
94 -
 95
95 -
 96
96 -
 97
97 -
 98
98 -
 99
99 -
 100
100 -
 101
101 -
 102
102 -
 103
103 -
 104
104 -
 105
105 -
 106
106 -
 107
107 -
 108
108 -
 109
109 -
 110
110 -
 111
111 -
 112
112 -
 113
113 -
 114
114 -
115
-
116
-
117
-
118
-
119
-
120
-
121
-
122
-
123
-
124
-
125
-
126
-
127
-
128
-
129
-
130
-
131
-
132
-
133
-
134
-
135
-
136
-
137
-
138
-
139
-
140
-
141
-
142
-
143
-
144
-
145
-
146
-
147
-
148
-
149
-
150
-
151
-
152
 |
 |

42
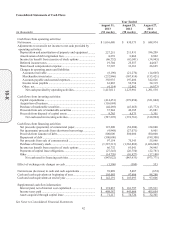
Consolidated Statements of Cash Flows
Year Ended
(in thousands)
August 31,
2013
(53 weeks)
August 25,
2012
(52 weeks)
August 27,
2011
(52 weeks)
Cash flows from operating activities:
Net income ...................................................................................... $ 1,016,480 $ 930,373 $ 848,974
Adjustments to reconcile net income to net cash provided by
operating activities:
Depreciation and amortization of property and equipmen
t
.......... 227,251 211,831 196,209
Amortization of debt origination fees .......................................... 8,239 8,066 8,962
Income tax benefit from exercise of stock options ...................... (66,752) (63,041) (34,945)
Deferred income taxes ................................................................. 19,704 25,557 44,667
Share-based compensation expense ............................................. 37,307 33,363 26,625
Changes in operating assets and liabilities:
Accounts receivable ................................................................. (8,196) (21,276) (14,605)
Merchandise inventories .......................................................... (232,846) (167,914) (155,421)
Accounts payable and accrued expenses .................................. 356,935 197,406 342,826
Income taxes payable ............................................................... 61,003 56,754 34,319
Other, net .................................................................................. (4,114) 12,862 (6,073)
Net cash provided by operating activities ............................. 1,415,011 1,223,981 1,291,538
Cash flows from investing activities:
Capital expenditures .................................................................... (414,451) (378,054) (321,604)
Acquisition of business ................................................................ (116,084) – –
Purchase of marketable securities ................................................ (44,469) (45,665) (43,772)
Proceeds from sale of marketable securities ................................ 37,944 42,385 43,081
Proceeds from disposal of capital assets ...................................... 9,765 6,573 3,301
Net cash used in investing activities ..................................... (527,295) (374,761) (318,994)
Cash flows from financing activities:
Net proceeds (payments) of commercial paper ............................ 123,600 (54,200) 134,600
Net (payments) proceeds from short-term borrowings ................ (4,948) (27,071) 6,901
Proceeds from issuance of debt .................................................... 800,000 500,000 500,000
Repayment of debt ....................................................................... (500,000) – (199,300)
Net proceeds from sale of common stock .................................... 97,154 75,343 55,846
Purchase of treasury stock ........................................................... (1,387,315) (1,362,869) (1,466,802)
Income tax benefit from exercise of stock options ...................... 66,752 63,041 34,945
Payments of capital lease obligations .......................................... (27,545) (26,750) (22,781)
Other ............................................................................................ (14,720) (10,927) (17,180)
Net cash used in financing activities .................................... (847,022) (843,433) (973,771)
Effect of exchange rate changes on cash ......................................... (1,596) (300) 553
Net increase (decrease) in cash and cash equivalents ..................... 39,098 5,487 (674)
Cash and cash equivalents at beginning of year .............................. 103,093 97,606 98,280
Cash and cash equivalents at end of year ........................................ $ 142,191 $ 103,093 $ 97,606
Supplemental cash flow information:
Interest paid, net of interest cost capitalized ................................ $ 174,037 $ 161,797 $ 155,531
Income taxes paid ........................................................................ $ 498,587 $ 443,666 $ 405,654
Assets acquired through capital lease .......................................... $ 71,117 $ 74,726 $ 32,301
See Notes to Consolidated Financial Statements.
10-K