AutoZone 2013 Annual Report Download - page 126
Download and view the complete annual report
Please find page 126 of the 2013 AutoZone annual report below. You can navigate through the pages in the report by either clicking on the pages listed below, or by using the keyword search tool below to find specific information within the annual report.-
 1
1 -
2
-
3
-
4
-
5
-
6
-
7
-
8
-
9
-
10
-
11
-
12
-
13
-
14
-
15
-
16
-
17
-
18
-
19
-
20
-
21
-
22
-
23
-
24
-
25
-
26
-
27
-
28
-
29
-
30
-
31
-
32
-
33
-
34
-
35
-
36
-
37
-
38
-
39
-
40
-
41
-
42
-
43
-
44
-
45
-
46
-
47
-
48
-
49
-
50
-
51
-
52
-
53
-
54
-
55
-
56
-
57
-
58
-
59
-
60
-
61
-
62
-
63
-
64
-
65
-
66
-
67
-
68
-
69
-
70
-
71
-
72
-
73
-
74
-
75
-
76
-
77
-
78
-
79
-
80
-
81
-
82
-
83
-
84
-
85
-
86
-
87
-
88
-
89
-
90
-
91
-
92
-
93
-
94
-
95
-
96
-
97
-
98
-
99
-
100
-
101
-
102
-
103
-
104
-
105
-
106
-
107
-
108
-
109
-
110
-
111
-
112
-
113
-
114
-
115
-
 116
116 -
 117
117 -
 118
118 -
 119
119 -
 120
120 -
 121
121 -
 122
122 -
 123
123 -
 124
124 -
 125
125 -
 126
126 -
 127
127 -
 128
128 -
 129
129 -
 130
130 -
 131
131 -
 132
132 -
 133
133 -
 134
134 -
 135
135 -
 136
136 -
137
-
138
-
139
-
140
-
141
-
142
-
143
-
144
-
145
-
146
-
147
-
148
-
149
-
150
-
151
-
152
 |
 |

64
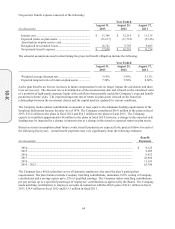
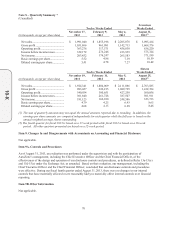
Net periodic benefit expense consisted of the following:
Year Ended
(in thousands)
August 31,
2013
August 25,
2012
August 27,
2011
Interest cost ......................................................................... $ 11,746 $ 12,214 $ 11,135
Expected return on plan assets ............................................ (13,617) (11,718) (9,326)
Amortization of prior service cost ....................................... – – –
Recognized net actuarial losses ........................................... 14,721 9,795 9,405
Net periodic benefit expense ............................................... $ 12,850 $ 10,291 $ 11,214
The actuarial assumptions used in determining the projected benefit obligation include the following:
Year Ended
August 31,
2013
August 25,
2012
August 27,
2011
Weighted average discount rate .......................................... 5.19% 3.90% 5.13%
Expected long-term rate of return on plan assets ................ 7.50% 7.50% 8.00%
As the plan benefits are frozen, increases in future compensation levels no longer impact the calculation and there
is no service cost. The discount rate is determined as of the measurement date and is based on the calculated yield
of a portfolio of high-grade corporate bonds with cash flows that generally match the Company’s expected benefit
payments in future years. The expected long-term rate of return on plan assets is based on the historical
relationships between the investment classes and the capital markets, updated for current conditions.
The Company makes annual contributions in amounts at least equal to the minimum funding requirements of the
Employee Retirement Income Security Act of 1974. The Company contributed $16.9 million to the plans in fiscal
2013, $15.4 million to the plans in fiscal 2012 and $34.1 million to the plans in fiscal 2011. The Company
expects to contribute approximately $4 million to the plans in fiscal 2014; however, a change to the expected cash
funding may be impacted by a change in interest rates or a change in the actual or expected return on plan assets.
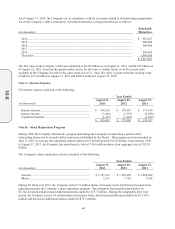
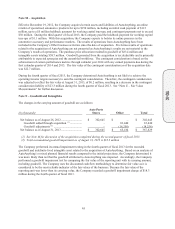
Based on current assumptions about future events, benefit payments are expected to be paid as follows for each of
the following fiscal years. Actual benefit payments may vary significantly from the following estimates:
(in thousands)
Benefit
Payments
2014 ............................................................................................................................................. $ 9,125
2015 ............................................................................................................................................. 9,205
2016 ............................................................................................................................................. 9,912
2017 ............................................................................................................................................. 10,604
2018 ............................................................................................................................................. 11,193
2019
–
2023 .................................................................................................................................. 65,396
The Company has a 401(k) plan that covers all domestic employees who meet the plan’s participation
requirements. The plan features include Company matching contributions, immediate 100% vesting of Company
contributions and a savings option up to 25% of qualified earnings. The Company makes matching contributions,
per pay period, up to a specified percentage of employees’ contributions as approved by the Board. The Company
made matching contributions to employee accounts in connection with the 401(k) plan of $14.1 million in fiscal
2013, $14.4 million in fiscal 2012 and $13.3 million in fiscal 2011.
10-K