AutoZone 2013 Annual Report Download - page 90
Download and view the complete annual report
Please find page 90 of the 2013 AutoZone annual report below. You can navigate through the pages in the report by either clicking on the pages listed below, or by using the keyword search tool below to find specific information within the annual report.-
 1
1 -
2
-
3
-
4
-
5
-
6
-
7
-
8
-
9
-
10
-
11
-
12
-
13
-
14
-
15
-
16
-
17
-
18
-
19
-
20
-
21
-
22
-
23
-
24
-
25
-
26
-
27
-
28
-
29
-
30
-
31
-
32
-
33
-
34
-
35
-
36
-
37
-
38
-
39
-
40
-
41
-
42
-
43
-
44
-
45
-
46
-
47
-
48
-
49
-
50
-
51
-
52
-
53
-
54
-
55
-
56
-
57
-
58
-
59
-
60
-
61
-
62
-
63
-
64
-
65
-
66
-
67
-
68
-
69
-
70
-
71
-
72
-
73
-
74
-
75
-
76
-
77
-
78
-
79
-
 80
80 -
 81
81 -
 82
82 -
 83
83 -
 84
84 -
 85
85 -
 86
86 -
 87
87 -
 88
88 -
 89
89 -
 90
90 -
 91
91 -
 92
92 -
 93
93 -
 94
94 -
 95
95 -
 96
96 -
 97
97 -
 98
98 -
 99
99 -
 100
100 -
101
-
102
-
103
-
104
-
105
-
106
-
107
-
108
-
109
-
110
-
111
-
112
-
113
-
114
-
115
-
116
-
117
-
118
-
119
-
120
-
121
-
122
-
123
-
124
-
125
-
126
-
127
-
128
-
129
-
130
-
131
-
132
-
133
-
134
-
135
-
136
-
137
-
138
-
139
-
140
-
141
-
142
-
143
-
144
-
145
-
146
-
147
-
148
-
149
-
150
-
151
-
152
 |
 |
28
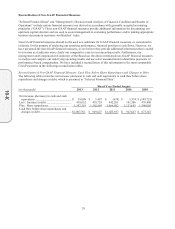
Reconciliation of Non-GAAP Financial Measures
“Selected Financial Data” and “Management’s Discussion and Analysis of Financial Condition and Results of
Operations” include certain financial measures not derived in accordance with generally accepted accounting
principles (“GAAP”). These non-GAAP financial measures provide additional information for determining our
optimum capital structure and are used to assist management in evaluating performance and in making appropriate
business decisions to maximize stockholders’ value.
Non-GAAP financial measures should not be used as a substitute for GAAP financial measures, or considered in
isolation, for the purpose of analyzing our operating performance, financial position or cash flows. However, we
have presented the non-GAAP financial measures, as we believe they provide additional information that is useful
to investors as it indicates more clearly our comparative year-to-year operating results. Furthermore, our
management and Compensation Committee of the Board use the above-mentioned non-GAAP financial measures
to analyze and compare our underlying operating results and use select measurements to determine payments of
performance-based compensation. We have included a reconciliation of this information to the most comparable
GAAP measures in the following reconciliation tables.
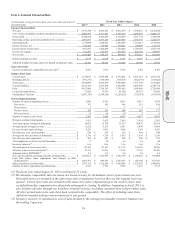
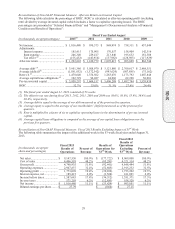
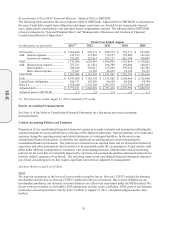
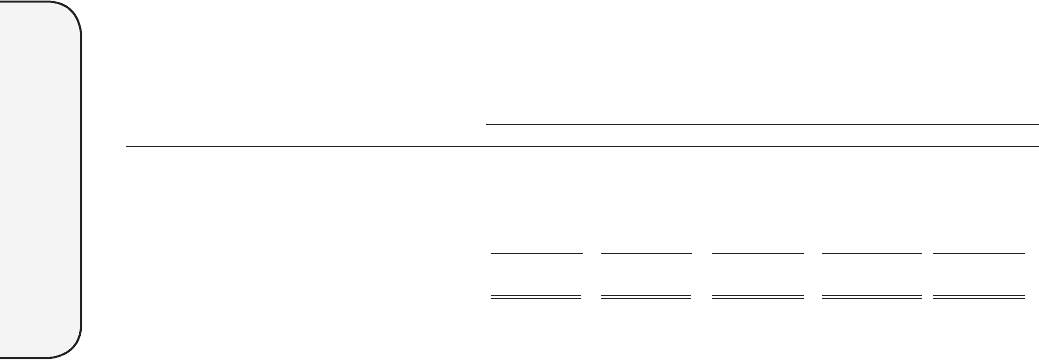
Reconciliation of Non-GAAP Financial Measure: Cash Flow Before Share Repurchases and Changes in Debt
The following table reconciles net increase (decrease) in cash and cash equivalents to cash flow before share
repurchases and changes in debt, which is presented in “Selected Financial Data”:
Fiscal Year Ended August
(in thousands) 2013 2012 2011 2010 2009
N
e
t
increase (decrease) in cash and cash
equivalents ................................................. $ 39,098 $ 5,487 $ (674) $ 5,574 $ (149,755)
Less: Increase in deb
t
................................... 418,652 418,729 442,201 181,586 476,900
Plus: Share repurchases ............................... 1,387,315 1,362,869 1,466,802 1,123,655 1,300,002
Cash flow before share repurchases and
changes in deb
t
........................................... $1,007,761 $ 949,627 $1,023,927 $947,643
$ 673,347
10-K