AutoZone 2013 Annual Report Download - page 43
Download and view the complete annual report
Please find page 43 of the 2013 AutoZone annual report below. You can navigate through the pages in the report by either clicking on the pages listed below, or by using the keyword search tool below to find specific information within the annual report.-
 1
1 -
2
-
3
-
4
-
5
-
6
-
7
-
8
-
9
-
10
-
11
-
12
-
13
-
14
-
15
-
16
-
17
-
18
-
19
-
20
-
21
-
22
-
23
-
24
-
25
-
26
-
27
-
28
-
29
-
30
-
31
-
32
-
 33
33 -
 34
34 -
 35
35 -
 36
36 -
 37
37 -
 38
38 -
 39
39 -
 40
40 -
 41
41 -
 42
42 -
 43
43 -
 44
44 -
 45
45 -
 46
46 -
 47
47 -
 48
48 -
 49
49 -
 50
50 -
 51
51 -
 52
52 -
 53
53 -
54
-
55
-
56
-
57
-
58
-
59
-
60
-
61
-
62
-
63
-
64
-
65
-
66
-
67
-
68
-
69
-
70
-
71
-
72
-
73
-
74
-
75
-
76
-
77
-
78
-
79
-
80
-
81
-
82
-
83
-
84
-
85
-
86
-
87
-
88
-
89
-
90
-
91
-
92
-
93
-
94
-
95
-
96
-
97
-
98
-
99
-
100
-
101
-
102
-
103
-
104
-
105
-
106
-
107
-
108
-
109
-
110
-
111
-
112
-
113
-
114
-
115
-
116
-
117
-
118
-
119
-
120
-
121
-
122
-
123
-
124
-
125
-
126
-
127
-
128
-
129
-
130
-
131
-
132
-
133
-
134
-
135
-
136
-
137
-
138
-
139
-
140
-
141
-
142
-
143
-
144
-
145
-
146
-
147
-
148
-
149
-
150
-
151
-
152
 |
 |

Proxy
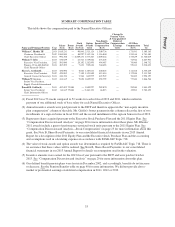
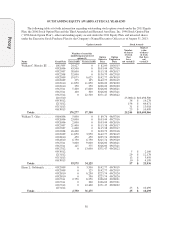
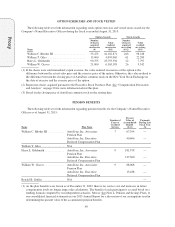
SUMMARY COMPENSATION TABLE
This table shows the compensation paid to the Named Executive Officers.
Name and Principal Position Year
Salary
($)(1)
Bonus
($)(2)
Stock
Awards
($)(3)(4)
Option
Awards
($)(4)
Non-Equity
Incentive Plan
Compensation
($)(5)
Change In
Pension Value
& Non-qualified
Deferred
Compensation
Earnings
($)(6)
All Other
Compensation
($)(7)
Total
($)
William C. Rhodes III ...... 2013 1,019,231 — 90,043 2,513,124 1,509,736 — 173,031 5,305,165
Chairman, President & 2012 1,000,000 — 88,997 2,142,316 1,316,000 — 194,168 4,741,481
Chief Executive Officer 2011 992,308 — 6,609,251 1,575,207 2,009,424 — 173,829 11,360,019
William T. Giles ........... 2013 536,039 — 21,521 1,519,044 476,405 — 74,942 2,627,951
Executive Vice President, 2012 501,000 — 20,192 1,262,993 494,487 — 70,060 2,348,732
Finance, IT & ALLDATA/ 2011 487,692 — 7,633 919,610 740,683 — 55,013 2,210,631
Chief Financial Officer
Harry L. Goldsmith ........ 2013 450,096 — 8,861 1,385,011 400,023 — 111,468 2,355,459
Executive Vice President, 2012 420,885 — 7,149 1,151,849 415,414 — 117,948 2,113,245
General Counsel & Secretary 2011 410,154 — 3,544 842,975 622,922 — 70,602 1,950,197
William W. Graves ......... 2013 414,615 — 9,850 1,049,927 294,792 — 77,360 1,846,544
Senior Vice President,
Supply Chain & International
Ronald B. Griffin(8) ........ 2013 407,692 75,000 — 1,049,927 289,870 — 20,940 1,843,429
Senior Vice President/ 2012 84,615 75,000 — 2,463,121 66,813 — 12,903 2,702,452
Chief Information Officer
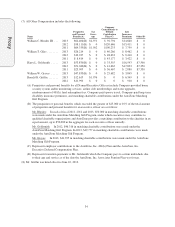
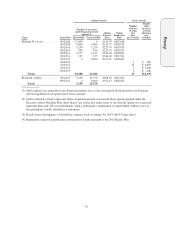
(1) Fiscal 2013 was 53 weeks compared to 52 weeks for each of fiscal 2012 and 2011, which resulted in
payment of one additional week of base salary for each Named Executive Officer.
(2) Annual incentive awards were paid pursuant to the EICP and therefore appear in the “non-equity incentive
plan compensation” column of the table. Mr. Griffin’s bonus payment in this column reflects the first of two
installments of a sign-on bonus in fiscal 2012 and the second installment of the sign-on bonus in fiscal 2013.
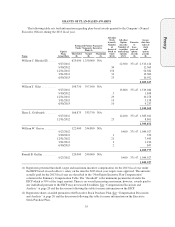
(3) Represents shares acquired pursuant to the Executive Stock Purchase Plan and the 2011 Equity Plan. See
“Compensation Discussion and Analysis” on page 20 for more information about these plans. Mr. Rhodes’
2011 awards include a grant of performance-restricted stock units pursuant to the 2011 Equity Plan. See
“Compensation Discussion and Analysis—Stock Compensation” on page 25 for more information about this
grant. See Note B, Share-Based Payments, to our consolidated financial statements in our 2013 Annual
Report for a description of the 2011 Equity Plan and the Executive Stock Purchase Plan and the accounting
and assumptions used in calculating expenses in accordance with FASB ASC Topic 718.
(4) The value of stock awards and option awards was determined as required by FASB ASC Topic 718. There is
no assurance that these values will be realized. See Note B, Share-Based Payments, to our consolidated
financial statements in our 2013 Annual Report for details on assumptions used in the valuation.
(5) Incentive amounts were earned for the 2013 fiscal year pursuant to the EICP and were paid in October,
2013. See “Compensation Discussion and Analysis” on page 20 for more information about this plan.
(6) Our defined benefit pension plans were frozen in December 2002, and accordingly, benefits do not increase
or decrease. See the Pension Benefits table on page 40 for more information. We did not provide above-
market or preferential earnings on deferred compensation in 2011, 2012 or 2013.
33