AutoZone 2013 Annual Report Download - page 82
Download and view the complete annual report
Please find page 82 of the 2013 AutoZone annual report below. You can navigate through the pages in the report by either clicking on the pages listed below, or by using the keyword search tool below to find specific information within the annual report.-
 1
1 -
2
-
3
-
4
-
5
-
6
-
7
-
8
-
9
-
10
-
11
-
12
-
13
-
14
-
15
-
16
-
17
-
18
-
19
-
20
-
21
-
22
-
23
-
24
-
25
-
26
-
27
-
28
-
29
-
30
-
31
-
32
-
33
-
34
-
35
-
36
-
37
-
38
-
39
-
40
-
41
-
42
-
43
-
44
-
45
-
46
-
47
-
48
-
49
-
50
-
51
-
52
-
53
-
54
-
55
-
56
-
57
-
58
-
59
-
60
-
61
-
62
-
63
-
64
-
65
-
66
-
67
-
68
-
69
-
70
-
71
-
 72
72 -
 73
73 -
 74
74 -
 75
75 -
 76
76 -
 77
77 -
 78
78 -
 79
79 -
 80
80 -
 81
81 -
 82
82 -
 83
83 -
 84
84 -
 85
85 -
 86
86 -
 87
87 -
 88
88 -
 89
89 -
 90
90 -
 91
91 -
 92
92 -
93
-
94
-
95
-
96
-
97
-
98
-
99
-
100
-
101
-
102
-
103
-
104
-
105
-
106
-
107
-
108
-
109
-
110
-
111
-
112
-
113
-
114
-
115
-
116
-
117
-
118
-
119
-
120
-
121
-
122
-
123
-
124
-
125
-
126
-
127
-
128
-
129
-
130
-
131
-
132
-
133
-
134
-
135
-
136
-
137
-
138
-
139
-
140
-
141
-
142
-
143
-
144
-
145
-
146
-
147
-
148
-
149
-
150
-
151
-
152
 |
 |

20
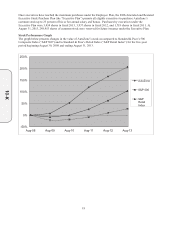
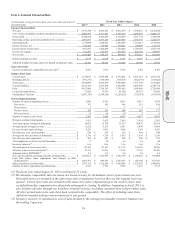
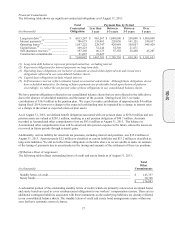
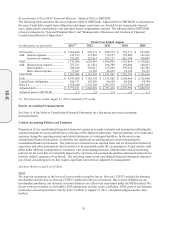
(4) After-tax return on invested capital is defined as after-tax operating profit (excluding rent charges) divided by
average invested capital (which includes a factor to capitalize operating leases). See Reconciliation of Non-
GAAP Financial Measures in Management’s Discussion and Analysis of Financial Condition and Results of
Operations.
(5) Adjusted debt to EBITDAR is defined as the sum of total debt, capital lease obligations and annual rents times
six; divided by net income plus interest, taxes, depreciation, amortization, rent and share-based compensation
expense. See Reconciliation of Non-GAAP Financial Measures in Management’s Discussion and Analysis of
Financial Condition and Results of Operations.
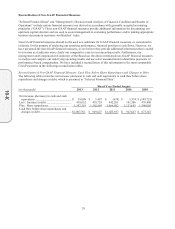
(6) Cash flow before share repurchases and changes in debt is defined as the change in cash and cash equivalents
less the change in debt plus treasury stock purchases. See Reconciliation of Non-GAAP Financial Measures
in Management’s Discussion and Analysis of Financial Condition and Results of Operations.
Item 7. Management’s Discussion and Analysis of Financial Condition and Results of Operations
We are the nation’s leading retailer, and a leading distributor, of automotive replacement parts and accessories in
the United States. We began operations in 1979 and at August 31, 2013, operated 4,836 stores in the United
States, including Puerto Rico; 362 in Mexico; and three in Brazil. Each of our stores carries an extensive product
line for cars, sport utility vehicles, vans and light trucks, including new and remanufactured automotive hard parts,
maintenance items, accessories and non-automotive products. At August 31, 2013, in 3,421 of our domestic
stores, we also have a commercial sales program that provides commercial credit and prompt delivery of parts and
other products to local, regional and national repair garages, dealers, service stations and public sector accounts.
We also have commercial programs in select stores in Mexico, as well as in our stores in Brazil. We also sell the
ALLDATA brand automotive diagnostic and repair software through www.alldata.com. Additionally, we sell
automotive hard parts, maintenance items, accessories, and non-automotive products through www.autozone.com,
and accessories and performance parts through www.autoanything.com, and our commercial customers can make
purchases through www.autozonepro.com. We do not derive revenue from automotive repair or installation
services.
Executive Summary
We achieved strong performance in fiscal 2013, delivering record net income of $1.016 billion, a 9.3% increase
over the prior year, and sales growth of $543.7 million, a 6.3% increase over the prior year. We completed the
year with growth in all areas of our business. We are pleased with the results of our retail business and the
increase in our commercial business, where we continue to build our internal sales force and continue to refine our
parts assortment. Over the past several years, various factors have occurred within the economy that affect both
our customers and our industry, including the impact of the recession, continued high unemployment, and other
challenging economic conditions. Although we have seen a recent increase in new vehicle sales, we believe our
consumers’ cash flows continue to decrease due to the previously listed factors. Given the nature of these
macroeconomic factors, we cannot predict whether or for how long these trends will continue, nor can we predict
to what degree these trends will impact us in the future.
We believe other macroeconomic factors have adversely affected both our customers and our industry. During
fiscal 2013, the average price per gallon of unleaded gasoline in the United States remained at a high level, $3.65
per gallon, compared to $3.57 per gallon during fiscal 2012. We continue to believe gas prices will remain at
overall high levels, thereby reducing discretionary spending for all consumers, and, in particular, our customers.
With approximately 11 billion gallons of unleaded gas consumed each month across the U.S., each $1 decrease at
the pump contributes approximately $11 billion of additional spending capacity to consumers each month. Given
the unpredictability of gas prices, we cannot predict whether gas prices will increase or decrease, nor can we
predict how any future changes in gas prices will impact our sales in future periods.
An additional macroeconomic factor facing our customer is the reinstitution of payroll taxes back to historic
levels. The reduction in our customers’ take home pay as a result of the recent increase in payroll taxes was
effective at the beginning of the 2013 calendar year and, at this point, we cannot predict the impact this change
has had or will have on our sales in future periods.
During fiscal 2013, failure and maintenance related categories represented the largest portion of our sales mix, at
approximately 84% of total sales, with failure related categories continuing to be our strongest performers. While
10-K