AutoZone 2013 Annual Report Download - page 103
Download and view the complete annual report
Please find page 103 of the 2013 AutoZone annual report below. You can navigate through the pages in the report by either clicking on the pages listed below, or by using the keyword search tool below to find specific information within the annual report.-
 1
1 -
2
-
3
-
4
-
5
-
6
-
7
-
8
-
9
-
10
-
11
-
12
-
13
-
14
-
15
-
16
-
17
-
18
-
19
-
20
-
21
-
22
-
23
-
24
-
25
-
26
-
27
-
28
-
29
-
30
-
31
-
32
-
33
-
34
-
35
-
36
-
37
-
38
-
39
-
40
-
41
-
42
-
43
-
44
-
45
-
46
-
47
-
48
-
49
-
50
-
51
-
52
-
53
-
54
-
55
-
56
-
57
-
58
-
59
-
60
-
61
-
62
-
63
-
64
-
65
-
66
-
67
-
68
-
69
-
70
-
71
-
72
-
73
-
74
-
75
-
76
-
77
-
78
-
79
-
80
-
81
-
82
-
83
-
84
-
85
-
86
-
87
-
88
-
89
-
90
-
91
-
92
-
 93
93 -
 94
94 -
 95
95 -
 96
96 -
 97
97 -
 98
98 -
 99
99 -
 100
100 -
 101
101 -
 102
102 -
 103
103 -
 104
104 -
 105
105 -
 106
106 -
 107
107 -
 108
108 -
 109
109 -
 110
110 -
 111
111 -
 112
112 -
 113
113 -
114
-
115
-
116
-
117
-
118
-
119
-
120
-
121
-
122
-
123
-
124
-
125
-
126
-
127
-
128
-
129
-
130
-
131
-
132
-
133
-
134
-
135
-
136
-
137
-
138
-
139
-
140
-
141
-
142
-
143
-
144
-
145
-
146
-
147
-
148
-
149
-
150
-
151
-
152
 |
 |
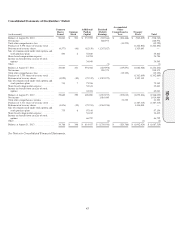
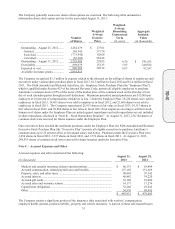
41
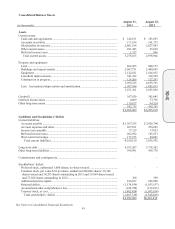
Consolidated Balance Sheets
(in thousands)
August 31,
2013
August 25,
2012
Assets
Current assets:
Cash and cash equivalents ........................................................................................ $ 142,191 $ 103,093
Accounts receivable ................................................................................................. 171,638 161,375
Merchandise inventories ........................................................................................... 2,861,014 2,627,983
Other current assets .................................................................................................. 101,443 85,649
Deferred income taxes .............................................................................................. 1,727 846
Total current assets ................................................................................................ 3,278,013 2,978,946
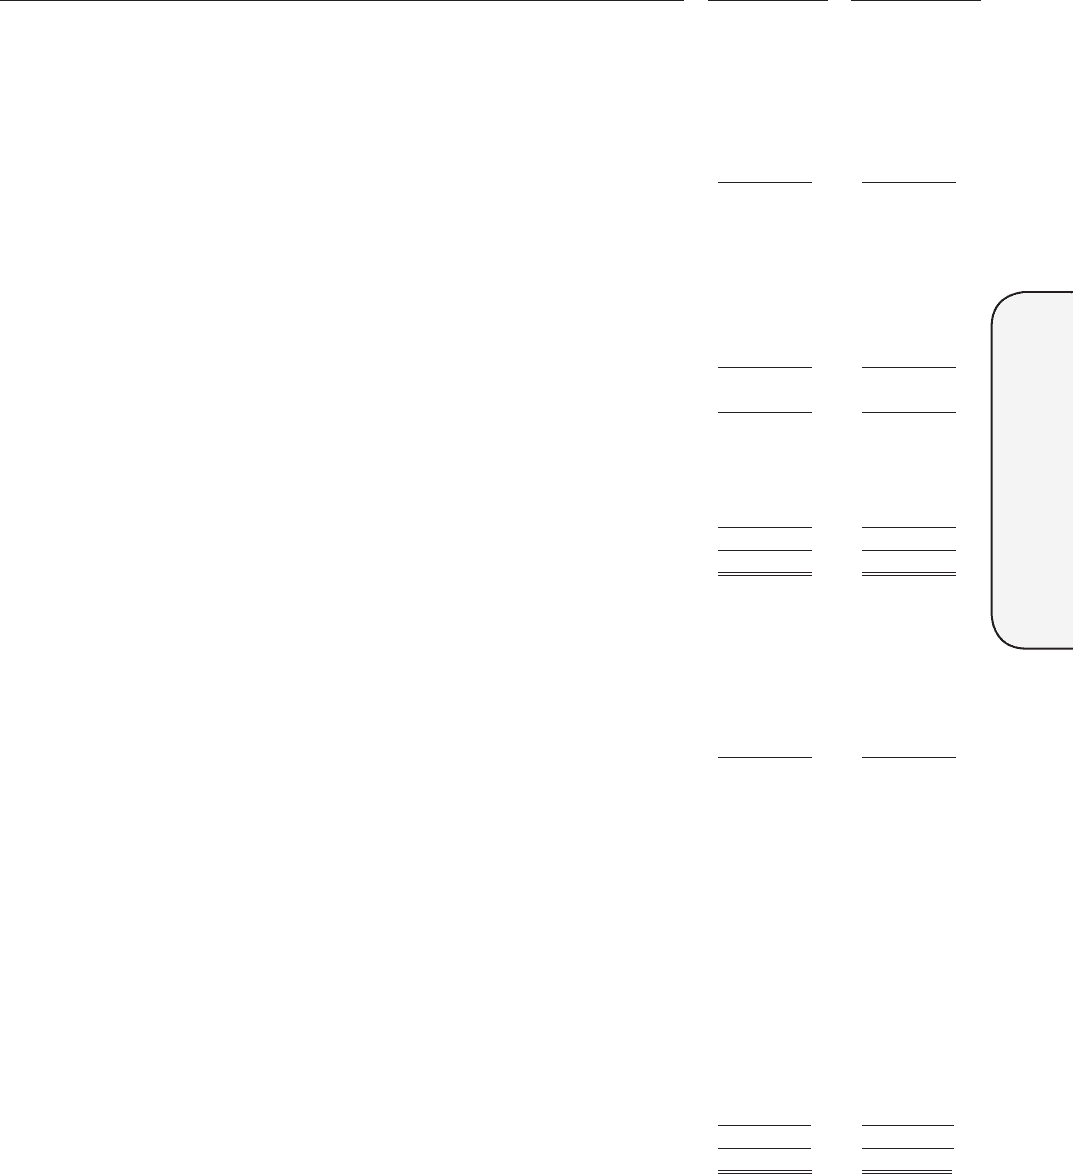
Property and equipment:
Land .......................................................................................................................... 862,565 800,175
Buildings and improvements .................................................................................... 2,607,751 2,400,895
Equipment ................................................................................................................ 1,122,821 1,016,835
Leasehold improvements .......................................................................................... 341,182 314,559
Construction in progress ........................................................................................... 124,206 127,297
5,058,525 4,659,761
Less: Accumulated depreciation and amortization .................................................. 1,987,164 1,803,833
3,071,361 2,855,928
Goodwill ...................................................................................................................... 367,829 302,645
Deferred income taxes ................................................................................................. 4,069 33,796
Other long-term assets ................................................................................................. 170,817 94,324
542,715 430,765
$ 6,892,089 $ 6,265,639
Liabilities and Stockholders’ Deficit
Current liabilities:
Accounts payable ..................................................................................................... $ 3,307,535 $ 2,926,740
Accrued expenses and other ..................................................................................... 467,831 478,085
Income taxes payable ............................................................................................... 17,129 17,053
Deferred income taxes .............................................................................................. 202,922 183,833
Short-term borrowings ............................................................................................. 173,733 49,881
Total current liabilities ......................................................................................... 4,169,150 3,655,592
Long-term debt ............................................................................................................ 4,013,267 3,718,302
Other long-term liabilities ........................................................................................... 396,991 439,770
Commitments and contingencies ................................................................................. – –
Stockholders’ deficit:
Preferred stock, authorized 1,000 shares; no shares issued ...................................... – –
Common stock, par value $.01 per share, authorized 200,000 shares; 36,768
shares issued and 34,293 shares outstanding in 2013 and 39,869 shares issued
and 37,028 shares outstanding in 2012 ...................................................................
368
399
Additional paid-in capital ......................................................................................... 814,457 689,890
Retained deficit......................................................................................................... (1,378,936) (1,033,197)
Accumulated other comprehensive loss ................................................................... (120,788) (152,013)
Treasury stock, at cost .............................................................................................. (1,002,420) (1,053,104)
Total stockholders’ deficit .................................................................................... (1,687,319) (1,548,025)
$ 6,892,089 $6,265,639
See Notes to Consolidated Financial Statements.
10-K