AutoZone 2013 Annual Report Download - page 31
Download and view the complete annual report
Please find page 31 of the 2013 AutoZone annual report below. You can navigate through the pages in the report by either clicking on the pages listed below, or by using the keyword search tool below to find specific information within the annual report.-
 1
1 -
2
-
3
-
4
-
5
-
6
-
7
-
8
-
9
-
10
-
11
-
12
-
13
-
14
-
15
-
16
-
17
-
18
-
19
-
20
-
 21
21 -
 22
22 -
 23
23 -
 24
24 -
 25
25 -
 26
26 -
 27
27 -
 28
28 -
 29
29 -
 30
30 -
 31
31 -
 32
32 -
 33
33 -
 34
34 -
 35
35 -
 36
36 -
 37
37 -
 38
38 -
 39
39 -
 40
40 -
 41
41 -
42
-
43
-
44
-
45
-
46
-
47
-
48
-
49
-
50
-
51
-
52
-
53
-
54
-
55
-
56
-
57
-
58
-
59
-
60
-
61
-
62
-
63
-
64
-
65
-
66
-
67
-
68
-
69
-
70
-
71
-
72
-
73
-
74
-
75
-
76
-
77
-
78
-
79
-
80
-
81
-
82
-
83
-
84
-
85
-
86
-
87
-
88
-
89
-
90
-
91
-
92
-
93
-
94
-
95
-
96
-
97
-
98
-
99
-
100
-
101
-
102
-
103
-
104
-
105
-
106
-
107
-
108
-
109
-
110
-
111
-
112
-
113
-
114
-
115
-
116
-
117
-
118
-
119
-
120
-
121
-
122
-
123
-
124
-
125
-
126
-
127
-
128
-
129
-
130
-
131
-
132
-
133
-
134
-
135
-
136
-
137
-
138
-
139
-
140
-
141
-
142
-
143
-
144
-
145
-
146
-
147
-
148
-
149
-
150
-
151
-
152
 |
 |

Proxy
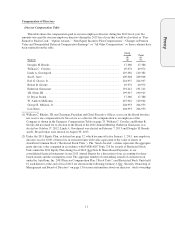
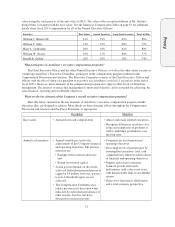
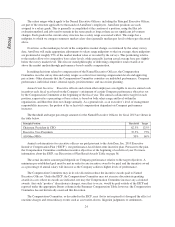
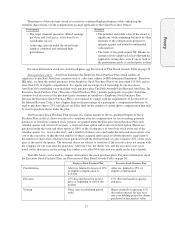
value (using the stock price as of the end of fiscal 2013). The value of the second installment of Mr. Griffin’s
hiring bonus is included with his base salary. See the Summary Compensation Table on page 33 for additional
details about fiscal 2013 compensation for all of the Named Executive Officers.
Executive Base Salary Annual Incentive Long-Term Incentive Total At-Risk
William C. Rhodes III 14% 21% 65% 86%
William T. Giles 21% 19% 60% 79%
Harry L. Goldsmith 20% 18% 62% 80%
William W. Graves 23% 17% 60% 77%
Ronald B. Griffin 26% 16% 58% 74%
Who participates in AutoZone’s executive compensation programs?
The Chief Executive Officer and the other Named Executive Officers, as well as the other senior executives
comprising AutoZone’s Executive Committee, participate in the compensation program outlined in this
Compensation Discussion and Analysis. The Executive Committee consists of the Chief Executive Officer and
officers with the title of senior vice president or executive vice president (a total of 11 executives at the end of
fiscal 2013). However, many elements of the compensation program also apply to other levels of AutoZone
management. The intent is to ensure that management is motivated to pursue, and is rewarded for achieving, the
same financial, operating and stockholder objectives.
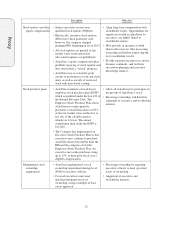
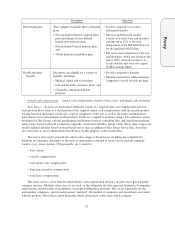
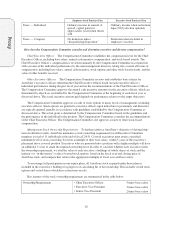
What are the key elements of the Company’s overall executive compensation program?
The table below summarizes the key elements of AutoZone’s executive compensation program and the
objectives they are designed to achieve. More details on these elements follow throughout the Compensation
Discussion and Analysis and this Proxy Statement, as appropriate.
Description Objectives
Base salary • Annual fixed cash compensation. • Attract and retain talented executives.
• Recognize differences in relative size,
scope and complexity of positions as
well as individual performance over
the long term.
Annual cash incentive • Annual variable pay tied to the
achievement of key Company financial
and operating objectives. The primary
measures are:
• Earnings before interest and taxes,
and
• Return on invested capital.
• Actual payout depends on the results
achieved. Individual potential payout is
capped at $4 million; however, payout
is zero if threshold targets are not
achieved.
• The Compensation Committee may
reduce payouts in its discretion when
indicated by individual performance or
other reasons, but does not have
discretion to increase payouts.
• Communicate key financial and
operating objectives.
• Drive high levels of performance by
ensuring that executives’ total cash
compensation is linked to achievement
of financial and operating objectives.
• Support and reward consistent,
balanced growth and returns
performance (add value every year)
with demonstrable links to stockholder
returns.
• Drive cross-functional collaboration
and a total-company perspective.
21