AutoZone 2013 Annual Report Download - page 112
Download and view the complete annual report
Please find page 112 of the 2013 AutoZone annual report below. You can navigate through the pages in the report by either clicking on the pages listed below, or by using the keyword search tool below to find specific information within the annual report.
50
Under the 2003 Option Plan, each non-employee director received an option grant on January 1 of each year, and
each new non-employee director received an option to purchase 3,000 shares upon election to the Board, plus a
portion of the annual directors’ option grant prorated for the portion of the year actually served. These stock
option grants were made at the fair market value as of the grant date and generally vested three years from the
grant date. There were 51,000 and 104,679 outstanding options under the 2003 Option Plan as of August 31,
2013 and August 25, 2012, respectively. No additional shares of stock or units will be issued in future years
under the 2003 Option Plan.
The Company has estimated the fair value of all stock option awards as of the date of the grant by applying the
Black-Scholes-Merton multiple-option pricing valuation model. The application of this valuation model involves
assumptions that are judgmental and highly sensitive in the determination of compensation expense. The
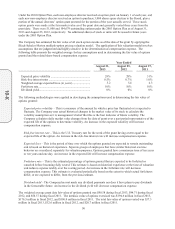
following table presents the weighted average for key assumptions used in determining the fair value of options
granted and the related share-based compensation expense:
Year Ended
August 31,
2013
August 25,
2012
August 27,
2011
Expected price volatility ..................................................... 29% 28% 31%
Risk-free interest rates ........................................................ 0.5% 0.7% 1.0%
Weighted average expected lives (in years) ........................ 5.2 5.4 4.3
Forfeiture rate ...................................................................... 10% 10% 10%
Dividend yield ..................................................................... 0% 0% 0%
The following methodologies were applied in developing the assumptions used in determining the fair value of
options granted:
Expected price volatility – This is a measure of the amount by which a price has fluctuated or is expected to
fluctuate. The Company uses actual historical changes in the market value of its stock to calculate the
volatility assumption as it is management’s belief that this is the best indicator of future volatility. The
Company calculates daily market value changes from the date of grant over a past period representative of the
expected life of the options to determine volatility. An increase in the expected volatility will increase
compensation expense.
Risk-free interest rate – This is the U.S. Treasury rate for the week of the grant having a term equal to the
expected life of the option. An increase in the risk-free interest rate will increase compensation expense.
Expected lives – This is the period of time over which the options granted are expected to remain outstanding
and is based on historical experience. Separate groups of employees that have similar historical exercise
behavior are considered separately for valuation purposes. Options granted have a maximum term of ten years
or ten years and one day. An increase in the expected life will increase compensation expense.
Forfeiture rate – This is the estimated percentage of options granted that are expected to be forfeited or
canceled before becoming fully vested. This estimate is based on historical experience at the time of valuation
and reduces expense ratably over the vesting period. An increase in the forfeiture rate will decrease
compensation expense. This estimate is evaluated periodically based on the extent to which actual forfeitures
differ, or are expected to differ, from the previous estimate.
Dividend yield – The Company has not made any dividend payments nor does it have plans to pay dividends
in the foreseeable future. An increase in the dividend yield will decrease compensation expense.
The weighted average grant date fair value of options granted was $98.58 during fiscal 2013, $94.71 during fiscal
2012, and $58.57 during fiscal 2011. The intrinsic value of options exercised was $194.6 million in fiscal 2013,
$176.5 million in fiscal 2012, and $100.0 million in fiscal 2011. The total fair value of options vested was $37.3
million in fiscal 2013, $32.6 million in fiscal 2012, and $20.7 million in fiscal 2011.
10-K


