AutoZone 2013 Annual Report Download - page 89
Download and view the complete annual report
Please find page 89 of the 2013 AutoZone annual report below. You can navigate through the pages in the report by either clicking on the pages listed below, or by using the keyword search tool below to find specific information within the annual report.-
 1
1 -
2
-
3
-
4
-
5
-
6
-
7
-
8
-
9
-
10
-
11
-
12
-
13
-
14
-
15
-
16
-
17
-
18
-
19
-
20
-
21
-
22
-
23
-
24
-
25
-
26
-
27
-
28
-
29
-
30
-
31
-
32
-
33
-
34
-
35
-
36
-
37
-
38
-
39
-
40
-
41
-
42
-
43
-
44
-
45
-
46
-
47
-
48
-
49
-
50
-
51
-
52
-
53
-
54
-
55
-
56
-
57
-
58
-
59
-
60
-
61
-
62
-
63
-
64
-
65
-
66
-
67
-
68
-
69
-
70
-
71
-
72
-
73
-
74
-
75
-
76
-
77
-
78
-
 79
79 -
 80
80 -
 81
81 -
 82
82 -
 83
83 -
 84
84 -
 85
85 -
 86
86 -
 87
87 -
 88
88 -
 89
89 -
 90
90 -
 91
91 -
 92
92 -
 93
93 -
 94
94 -
 95
95 -
 96
96 -
 97
97 -
 98
98 -
 99
99 -
100
-
101
-
102
-
103
-
104
-
105
-
106
-
107
-
108
-
109
-
110
-
111
-
112
-
113
-
114
-
115
-
116
-
117
-
118
-
119
-
120
-
121
-
122
-
123
-
124
-
125
-
126
-
127
-
128
-
129
-
130
-
131
-
132
-
133
-
134
-
135
-
136
-
137
-
138
-
139
-
140
-
141
-
142
-
143
-
144
-
145
-
146
-
147
-
148
-
149
-
150
-
151
-
152
 |
 |

27
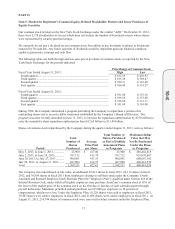
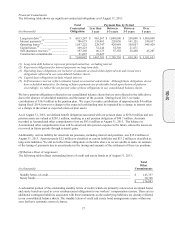
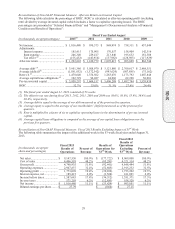
Financial Commitments
The following table shows our significant contractual obligations as of August 31, 2013:
(in thousands)
Total
Contractual
Obligations
Pa
y
ment Due b
y
Period
Less than
1 year
Between
1-3 years
Between
3-5 years
Over
5 years
Lon
g
-term debt
(1)
................................... $ 4,013,267 $ 963,267 $ 1,000,000 $ 250,000 $ 1,800,000
Interest payments
(2)
............................... 786,075 155,963 228,050 161,125 240,937
Operating leases
(3)
................................. 1,957,222 228,747 424,989 358,057 945,429
Capital leases
(4)
..................................... 109,223 32,246 55,306 21,671
–
Self-insurance reserves
(5)
..................... 197,268 66,133 57,358 28,490 45,287
Construction commitments ..................... 21,027 21,027
–
–
–
$ 7,084,082 $ 1,467,383 $ 1,765,703 $ 819,343 $ 3,031,653
(1) Long-term debt balances represent principal maturities, excluding interest.
(2) Represents obligations for interest payments on long-term debt.
(3) Operating lease obligations are inclusive of amounts accrued within deferred rent and closed store
obligations reflected in our consolidated balance sheets.
(4) Capital lease obligations include related interest.
(5) Self-insurance reserves reflect estimates based on actuarial calculations. Although these obligations do not
have scheduled maturities, the timing of future payments are predictable based upon historical patterns.
Accordingly, we reflect the net present value of these obligations in our consolidated balance sheets.
We have pension obligations reflected in our consolidated balance sheets that are not reflected in the table above
due to the absence of scheduled maturities and the nature of the account. During fiscal 2013, we made
contributions of $16.9 million to the pension plan. We expect to make contributions of approximately $4 million
during fiscal 2014; however a change to the expected cash funding may be impacted by a change in interest rates
or a change in the actual or expected return on plan assets.
As of August 31, 2013, our defined benefit obligation associated with our pension plans is $256.8 million and our
pension assets are valued at $208.1 million, resulting in a net pension obligation of $48.7 million. Amounts
recorded in Accumulated other comprehensive loss are $83.6 million at August 31, 2013. The balance in
Accumulated other comprehensive loss will be amortized into pension expense in the future, unless the losses are
recovered in future periods through actuarial gains.
Additionally, our tax liability for uncertain tax positions, including interest and penalties, was $35.4 million at
August 31, 2013. Approximately $2.2 million is classified as current liabilities and $33.2 million is classified as
long-term liabilities. We did not reflect these obligations in the table above as we are unable to make an estimate
of the timing of payments due to uncertainties in the timing and amounts of the settlement of these tax positions.
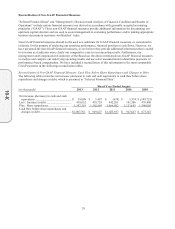
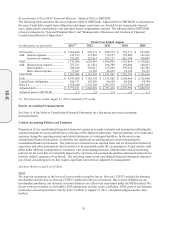
Off-Balance Sheet Arrangements
The following table reflects outstanding letters of credit and surety bonds as of August 31, 2013:
(in thousands)
Total
Other
Commitments
Standby letters of credi
t
.............................................................................................................
.
$ 145,357
Suret
y
bonds ..............................................................................................................................
.
30,726
$ 176,083
A substantial portion of the outstanding standby letters of credit (which are primarily renewed on an annual basis)
and surety bonds are used to cover reimbursement obligations to our workers’ compensation carriers. There are no
additional contingent liabilities associated with these instruments as the underlying liabilities are already reflected
in our consolidated balance sheets. The standby letters of credit and surety bond arrangements expire within one
year, but have automatic renewal clauses.
10-K