AutoZone 2013 Annual Report Download - page 131
Download and view the complete annual report
Please find page 131 of the 2013 AutoZone annual report below. You can navigate through the pages in the report by either clicking on the pages listed below, or by using the keyword search tool below to find specific information within the annual report.-
 1
1 -
2
-
3
-
4
-
5
-
6
-
7
-
8
-
9
-
10
-
11
-
12
-
13
-
14
-
15
-
16
-
17
-
18
-
19
-
20
-
21
-
22
-
23
-
24
-
25
-
26
-
27
-
28
-
29
-
30
-
31
-
32
-
33
-
34
-
35
-
36
-
37
-
38
-
39
-
40
-
41
-
42
-
43
-
44
-
45
-
46
-
47
-
48
-
49
-
50
-
51
-
52
-
53
-
54
-
55
-
56
-
57
-
58
-
59
-
60
-
61
-
62
-
63
-
64
-
65
-
66
-
67
-
68
-
69
-
70
-
71
-
72
-
73
-
74
-
75
-
76
-
77
-
78
-
79
-
80
-
81
-
82
-
83
-
84
-
85
-
86
-
87
-
88
-
89
-
90
-
91
-
92
-
93
-
94
-
95
-
96
-
97
-
98
-
99
-
100
-
101
-
102
-
103
-
104
-
105
-
106
-
107
-
108
-
109
-
110
-
111
-
112
-
113
-
114
-
115
-
116
-
117
-
118
-
119
-
120
-
 121
121 -
 122
122 -
 123
123 -
 124
124 -
 125
125 -
 126
126 -
 127
127 -
 128
128 -
 129
129 -
 130
130 -
 131
131 -
 132
132 -
 133
133 -
 134
134 -
 135
135 -
 136
136 -
 137
137 -
 138
138 -
 139
139 -
 140
140 -
 141
141 -
142
-
143
-
144
-
145
-
146
-
147
-
148
-
149
-
150
-
151
-
152
 |
 |

69
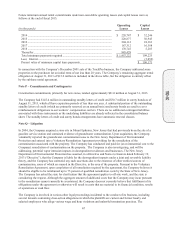
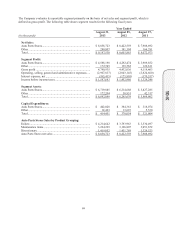
The Company evaluates its reportable segment primarily on the basis of net sales and segment profit, which is
defined as gross profit. The following table shows segment results for the following fiscal years:
Year Ended
(in thousands)
August 31,
2013
August 25,
2012
August 27,
2011
Net Sales:
Auto Parts Stores ................................................................. $ 8,858,723 $ 8,422,559 $ 7,906,692
Other ................................................................................... 288,807 181,304 166,281
Total .................................................................................... $ 9,147,530 $ 8,603,863 $ 8,072,973
Segment Profit:
Auto Parts Stores ................................................................. $ 4,568,190 $ 4,292,474 $ 3,989,852
Other ................................................................................... 172,745 139,562 129,611
Gross profit ......................................................................... 4,740,935 4,432,036 4,119,463
Operating, selling, general and administrative expenses ..... (2,967,837) (2,803,145) (2,624,660)
Interest expense, net ............................................................ (185,415) (175,905) (170,557)
Income before income taxes................................................ $ 1,587,683 $ 1,452,986 $ 1,324,246
Segment Assets:
Auto Parts Stores ................................................................. $ 6,719,885 $ 6,214,688 $ 5,827,285
Other ................................................................................... 172,204 50,951 42,317
Total .................................................................................... $ 6,892,089 $ 6,265,639 $ 5,869,602
Capital Expenditures:
Auto Parts Stores ................................................................. $ 402,028 $ 364,361 $ 316,074
Other ................................................................................... 12,423 13,693 5,530
Total .................................................................................... $ 414,451 $ 378,054 $ 321,604
Auto Parts Stores Sales by Product Grouping:
Failure .................................................................................. $ 4,214,642 $ 3,793,963 $ 3,530,497
Maintenance items ............................................................... 3,224,229 3,196,807 3,051,672
Discretionary ....................................................................... 1,419,852 1,431,789 1,324,523
Auto Parts Stores net sales .................................................. $ 8,858,723 $ 8,422,559 $ 7,906,692
10-K