AutoZone 2013 Annual Report Download - page 45
Download and view the complete annual report
Please find page 45 of the 2013 AutoZone annual report below. You can navigate through the pages in the report by either clicking on the pages listed below, or by using the keyword search tool below to find specific information within the annual report.-
 1
1 -
2
-
3
-
4
-
5
-
6
-
7
-
8
-
9
-
10
-
11
-
12
-
13
-
14
-
15
-
16
-
17
-
18
-
19
-
20
-
21
-
22
-
23
-
24
-
25
-
26
-
27
-
28
-
29
-
30
-
31
-
32
-
33
-
34
-
 35
35 -
 36
36 -
 37
37 -
 38
38 -
 39
39 -
 40
40 -
 41
41 -
 42
42 -
 43
43 -
 44
44 -
 45
45 -
 46
46 -
 47
47 -
 48
48 -
 49
49 -
 50
50 -
 51
51 -
 52
52 -
 53
53 -
 54
54 -
 55
55 -
56
-
57
-
58
-
59
-
60
-
61
-
62
-
63
-
64
-
65
-
66
-
67
-
68
-
69
-
70
-
71
-
72
-
73
-
74
-
75
-
76
-
77
-
78
-
79
-
80
-
81
-
82
-
83
-
84
-
85
-
86
-
87
-
88
-
89
-
90
-
91
-
92
-
93
-
94
-
95
-
96
-
97
-
98
-
99
-
100
-
101
-
102
-
103
-
104
-
105
-
106
-
107
-
108
-
109
-
110
-
111
-
112
-
113
-
114
-
115
-
116
-
117
-
118
-
119
-
120
-
121
-
122
-
123
-
124
-
125
-
126
-
127
-
128
-
129
-
130
-
131
-
132
-
133
-
134
-
135
-
136
-
137
-
138
-
139
-
140
-
141
-
142
-
143
-
144
-
145
-
146
-
147
-
148
-
149
-
150
-
151
-
152
 |
 |

Proxy
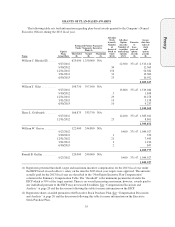
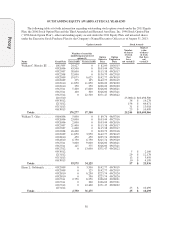
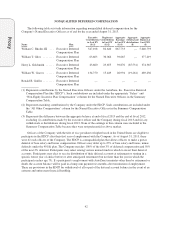
GRANTS OF PLAN-BASED AWARDS
The following table sets forth information regarding plan-based awards granted to the Company’s Named
Executive Officers during the 2013 fiscal year.
Equity
Plans
Grant Date
Estimated Future Payments
Under Nonequity Incentive
Plans(1)
All other
Stock
Awards:
Number
of
shares of
Stock or
Units
(#)(2)
All other
Option
Awards:
Number of
securities
underlying
options
(#)(3)
Exercise
or
base
price of
option
awards
($)
Grant
date fair
value of
stock
and
option
awards
($)Name
Threshold
($)
Target
($)
Maximum
($)
William C. Rhodes III ..... 625,000 1,250,000 N/A
9/27/2012 22,500 371.47 2,513,124
9/30/2012 34 12,569
12/31/2012 154 54,582
3/31/2013 31 12,300
6/30/2013 25 10,592
2,603,167
William T. Giles .......... 198,750 397,500 N/A
9/27/2012 13,600 371.47 1,519,044
9/30/2012 5 1,848
12/31/2012 29 10,278
3/31/2013 13 5,158
6/30/2013 10 4,237
1,540,565
Harry L. Goldsmith ....... 166,875 333,750 N/A
9/27/2012 12,400 371.47 1,385,011
12/31/2012 25 8,861
1,393,872
William W. Graves ........ 122,400 244,800 N/A
9/27/2012 9,400 371.47 1,049,927
9/30/2012 1 370
12/31/2012 21 7,443
3/31/2013 3 1,190
6/30/2013 2 847
1,059,777
Ronald B. Griffin ......... 120,000 240,000 N/A
9/27/2012 9,400 371.47 1,049,927
1,049,927
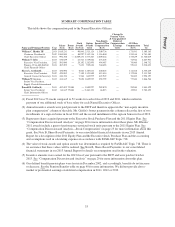
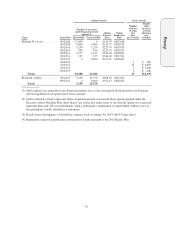
(1) Represents potential threshold, target and maximum incentive compensation for the 2013 fiscal year under
the EICP based on each officer’s salary on the date the 2013 fiscal year targets were approved. The amounts
actually paid for the 2013 fiscal year are described in the “Non-Equity Incentive Plan Compensation”
column in the Summary Compensation Table. The “threshold” is the minimum payment level under the
EICP which is 50% of the target amount. There is no overall percentage maximum; however, awards paid to
any individual pursuant to the EICP may not exceed $4 million. See “Compensation Discussion and
Analysis” at page 20 and the discussion following this table for more information on the EICP.
(2) Represents shares awarded pursuant to the Executive Stock Purchase Plan. See “Compensation Discussion
and Analysis” at page 20 and the discussion following this table for more information on the Executive
Stock Purchase Plan.
35