Audi 2015 Annual Report Download - page 298
Download and view the complete annual report
Please find page 298 of the 2015 Audi annual report below. You can navigate through the pages in the report by either clicking on the pages listed below, or by using the keyword search tool below to find specific information within the annual report.-
 1
1 -
2
-
3
-
4
-
5
-
6
-
7
-
8
-
9
-
10
-
11
-
12
-
13
-
14
-
15
-
16
-
17
-
18
-
19
-
20
-
21
-
22
-
23
-
24
-
25
-
26
-
27
-
28
-
29
-
30
-
31
-
32
-
33
-
34
-
35
-
36
-
37
-
38
-
39
-
40
-
41
-
42
-
43
-
44
-
45
-
46
-
47
-
48
-
49
-
50
-
51
-
52
-
53
-
54
-
55
-
56
-
57
-
58
-
59
-
60
-
61
-
62
-
63
-
64
-
65
-
66
-
67
-
68
-
69
-
70
-
71
-
72
-
73
-
74
-
75
-
76
-
77
-
78
-
79
-
80
-
81
-
82
-
83
-
84
-
85
-
86
-
87
-
88
-
89
-
90
-
91
-
92
-
93
-
94
-
95
-
96
-
97
-
98
-
99
-
100
-
101
-
102
-
103
-
104
-
105
-
106
-
107
-
108
-
109
-
110
-
111
-
112
-
113
-
114
-
115
-
116
-
117
-
118
-
119
-
120
-
121
-
122
-
123
-
124
-
125
-
126
-
127
-
128
-
129
-
130
-
131
-
132
-
133
-
134
-
135
-
136
-
137
-
138
-
139
-
140
-
141
-
142
-
143
-
144
-
145
-
146
-
147
-
148
-
149
-
150
-
151
-
152
-
153
-
154
-
155
-
156
-
157
-
158
-
159
-
160
-
161
-
162
-
163
-
164
-
165
-
166
-
167
-
168
-
169
-
170
-
171
-
172
-
173
-
174
-
175
-
176
-
177
-
178
-
179
-
180
-
181
-
182
-
183
-
184
-
185
-
186
-
187
-
188
-
189
-
190
-
191
-
192
-
193
-
194
-
195
-
196
-
197
-
198
-
199
-
200
-
201
-
202
-
203
-
204
-
205
-
206
-
207
-
208
-
209
-
210
-
211
-
212
-
213
-
214
-
215
-
216
-
217
-
218
-
219
-
220
-
221
-
222
-
223
-
224
-
225
-
226
-
227
-
228
-
229
-
230
-
231
-
232
-
233
-
234
-
235
-
236
-
237
-
238
-
239
-
240
-
241
-
242
-
243
-
244
-
245
-
246
-
247
-
248
-
249
-
250
-
251
-
252
-
253
-
254
-
255
-
256
-
257
-
258
-
259
-
260
-
261
-
262
-
263
-
264
-
265
-
266
-
267
-
268
-
269
-
270
-
271
-
272
-
273
-
274
-
275
-
276
-
277
-
278
-
279
-
280
-
281
-
282
-
283
-
284
-
285
-
286
-
287
-
 288
288 -
 289
289 -
 290
290 -
 291
291 -
 292
292 -
 293
293 -
 294
294 -
 295
295 -
 296
296 -
 297
297 -
 298
298 -
 299
299 -
 300
300
 |
 |
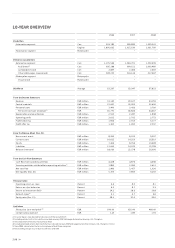
298 >>
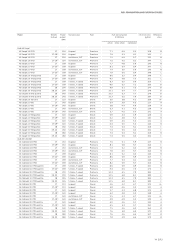
10-YEAR OVERVIEW
2006 2007 2008
Production
Automotive segment Cars 926,180 980,880 1,029,041
Engines 1,895,695 1,915,633 1,901,760
Motorcycles segment Motorcycles – – –
Deliveries to customers
Automotive segment Cars 1,135,554 1,200,701 1,223,506
Audi brand 4) Cars 905,188 964,151 1,003,469
Lamborghini brand Cars 2,087 2,406 2,430
Other Volkswagen Group brands Cars 228,279 234,144 217,607
Motorcycles segment Motorcycles – – –
Ducati brand Motorcycles – – –
Workforce Average 52,297 53,347 57,822
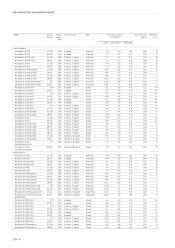
From the Income Statement
Revenue EUR million 31,142 33,617 34,196
Cost of materials EUR million 21,627 23,092 23,430
Personnel costs EUR million 3,440 3,406 3,709
Personnel costs per employee 5) EUR 65,771 63,846 64,467
Depreciation and amortization EUR million 2,515 2,287 1,908
Operating profit EUR million 2,015 2,705 2,772
Profit before tax EUR million 1,946 2,915 3,177
Profit after tax EUR million 1,343 1,692 2,207
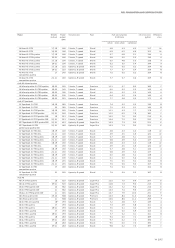
From the Balance Sheet (Dec. 31)
Non-current assets EUR million 8,285 8,325 9,537
Current assets EUR million 10,625 14,253 16,519
Equity EUR million 7,265 8,355 10,328
Liabilities EUR million 11,645 14,223 15,728
Balance sheet total EUR million 18,910 22,578 26,056
From the Cash Flow Statement
Cash flow from operating activities EUR million 4,428 4,876 4,338
Investing activities attributable to operating activities 6) EUR million 1,890 2,084 2,412
Net cash flow EUR million 1,986 2,457 1,926
Net liquidity (Dec. 31) EUR million 5,720 7,860 9,292
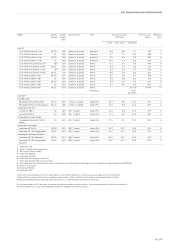
Financial ratios
Operating return on sales Percent 6.5 8.0 8.1
Return on sales before tax Percent 6.2 8.7 9.3
Return on investment (ROI) Percent 14.2 18.6 19.8
Ratio of capex 9) Percent 4.1 4.7 5.6
Equity ratio (Dec. 31) Percent 38.4 37.0 39.6
Audi share
Share price (year-end price) 10) EUR 540.00 625.00 466.49
Compensatory payment EUR 1.25 1.80 1.93
1) Financial figures were adjusted to take account of the revised IAS 19
2) Including vehicles built in China by the associated company FAW-Volkswagen Automotive Company, Ltd., Changchun
3) Since acquisition of the Ducati Group in July 2012
4) Including delivered vehicles built locally by the associated company FAW-Volkswagen Automotive Company, Ltd., Changchun (China)
5) Since 2008, calculated on the basis of employees of Audi Group companies
6) Not including changes in cash deposits and loans extended