Audi 2015 Annual Report Download - page 233
Download and view the complete annual report
Please find page 233 of the 2015 Audi annual report below. You can navigate through the pages in the report by either clicking on the pages listed below, or by using the keyword search tool below to find specific information within the annual report.-
 1
1 -
2
-
3
-
4
-
5
-
6
-
7
-
8
-
9
-
10
-
11
-
12
-
13
-
14
-
15
-
16
-
17
-
18
-
19
-
20
-
21
-
22
-
23
-
24
-
25
-
26
-
27
-
28
-
29
-
30
-
31
-
32
-
33
-
34
-
35
-
36
-
37
-
38
-
39
-
40
-
41
-
42
-
43
-
44
-
45
-
46
-
47
-
48
-
49
-
50
-
51
-
52
-
53
-
54
-
55
-
56
-
57
-
58
-
59
-
60
-
61
-
62
-
63
-
64
-
65
-
66
-
67
-
68
-
69
-
70
-
71
-
72
-
73
-
74
-
75
-
76
-
77
-
78
-
79
-
80
-
81
-
82
-
83
-
84
-
85
-
86
-
87
-
88
-
89
-
90
-
91
-
92
-
93
-
94
-
95
-
96
-
97
-
98
-
99
-
100
-
101
-
102
-
103
-
104
-
105
-
106
-
107
-
108
-
109
-
110
-
111
-
112
-
113
-
114
-
115
-
116
-
117
-
118
-
119
-
120
-
121
-
122
-
123
-
124
-
125
-
126
-
127
-
128
-
129
-
130
-
131
-
132
-
133
-
134
-
135
-
136
-
137
-
138
-
139
-
140
-
141
-
142
-
143
-
144
-
145
-
146
-
147
-
148
-
149
-
150
-
151
-
152
-
153
-
154
-
155
-
156
-
157
-
158
-
159
-
160
-
161
-
162
-
163
-
164
-
165
-
166
-
167
-
168
-
169
-
170
-
171
-
172
-
173
-
174
-
175
-
176
-
177
-
178
-
179
-
180
-
181
-
182
-
183
-
184
-
185
-
186
-
187
-
188
-
189
-
190
-
191
-
192
-
193
-
194
-
195
-
196
-
197
-
198
-
199
-
200
-
201
-
202
-
203
-
204
-
205
-
206
-
207
-
208
-
209
-
210
-
211
-
212
-
213
-
214
-
215
-
216
-
217
-
218
-
219
-
220
-
221
-
222
-
 223
223 -
 224
224 -
 225
225 -
 226
226 -
 227
227 -
 228
228 -
 229
229 -
 230
230 -
 231
231 -
 232
232 -
 233
233 -
 234
234 -
 235
235 -
 236
236 -
 237
237 -
 238
238 -
 239
239 -
 240
240 -
 241
241 -
 242
242 -
 243
243 -
244
-
245
-
246
-
247
-
248
-
249
-
250
-
251
-
252
-
253
-
254
-
255
-
256
-
257
-
258
-
259
-
260
-
261
-
262
-
263
-
264
-
265
-
266
-
267
-
268
-
269
-
270
-
271
-
272
-
273
-
274
-
275
-
276
-
277
-
278
-
279
-
280
-
281
-
282
-
283
-
284
-
285
-
286
-
287
-
288
-
289
-
290
-
291
-
292
-
293
-
294
-
295
-
296
-
297
-
298
-
299
-
300
 |
 |

NOTES TO THE CONSOLIDATED FINANCIAL STATEMENTS
RECOGNITION AND MEASUREMENT PRINCIPLES
>> 233
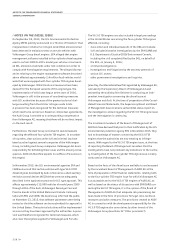
Depreciation is generally based on the following useful lives,
which are reassessed on a yearly basis:
Useful life
Buildings 14–50 years
Land improvements 10–33 years
Plant and machinery 6–12 years
Plant and office equipment including special tools 3–15 years
Property, plant and equipment used on the basis of lease
agreements is capitalized in the Balance Sheet if the condi-
tions of a finance lease are met in accordance with IAS 17, i.e.
if the significant opportunities and risks which result from the
use of an asset have passed to the lessee. Capitalization is
performed at fair value or the lower present value of the min-
imum lease payments. The straight-line depreciation method
is based on the shorter of economically useful life or term of
lease contract.
Where Group companies have entered into leasing arrange-
ments where not all opportunities and risks associated with
the leased property (operate lease) have passed to them, leas-
ing installments and rents are expensed directly in the Income
Statement.
/INVESTMENT PROPERTY
Land or buildings held with the intention of generating rental
income are reported in the Balance Sheet at amortized cost.
The amortization periods applied are, as a general rule, those
applied to property, plant and equipment used by the Group
itself. In the case of measurement at amortized cost, the fair
values calculated as a general rule using internal calculations
based on the discounted cash flow method are also to be
stated. These calculations are made based on the rental in-
come generated from real estate and the real estate-specific
discounting rates.
/INVESTMENTS ACCOUNTED FOR USING
THE EQUITY METHOD
Companies in which AUDI AG is directly or indirectly able to
exercise significant influence on financial and operating policy
decisions (associated companies) are accounted for using the
equity method. This means that changes in equity are reflected
on a pro rata basis in the carrying amount of the participation.
The share of the profit of the associated company is reported
under the financial result.
/BORROWING COSTS
Borrowing costs that can be allocated directly to a qualifying
asset are capitalized as part of that asset’s cost of purchase or
construction. A qualifying asset is deemed to exist if a relatively
long period of time will be required before the asset will be
ready for use or sale.
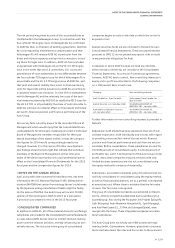
/IMPAIRMENT TESTS
Fixed assets are tested regularly for impairment as of the
balance sheet date.
With regard to impairment testing of goodwill and of other
intangible assets, the Audi Group as a general rule reports the
higher of value in use and fair value less costs to sell of the
respective cash generating units (brands and/or products). The
calculation of value in use is based on current planning pre-
pared by the management. This planning is based on expecta-
tions regarding the future development of the respective mar-
kets, market shares and profitability of the products. The plan-
ning period covers a period of five years. Plausible assumptions
about future development are made for the subsequent years.
In each case, the planning assumptions are adjusted in line with
current findings. Appropriate assumptions based on macro-
economic trends and historical developments are taken into
account.
Cash flows are, in principle, calculated on the basis of the
expected growth rates in the sales markets concerned. Growth
in the operating profit of the two cash generating units Auto-
motive and Motorcycles is expected up to the end of the
detailed planning period. Estimated cash flow following onto
the detailed planning period is based on an annual growth rate
of 1.0 (1.0) percent in the Automotive unit and 1.0 (1.0) percent
in the Motorcycles unit.
When testing goodwill and other intangible assets with indefi-
nite and limited useful lives, essentially capitalized develop-
ment costs, in the two cash generating units Automotive and
Motorcycles business for impairment, the value in use is
determined using the following average cost of capital (WACC)
before taxes:
%2015 2014
Automotive segment 6.5 6.1
Motorcycles segment 6.9 7.1