Audi 2015 Annual Report Download - page 167
Download and view the complete annual report
Please find page 167 of the 2015 Audi annual report below. You can navigate through the pages in the report by either clicking on the pages listed below, or by using the keyword search tool below to find specific information within the annual report.-
 1
1 -
2
-
3
-
4
-
5
-
6
-
7
-
8
-
9
-
10
-
11
-
12
-
13
-
14
-
15
-
16
-
17
-
18
-
19
-
20
-
21
-
22
-
23
-
24
-
25
-
26
-
27
-
28
-
29
-
30
-
31
-
32
-
33
-
34
-
35
-
36
-
37
-
38
-
39
-
40
-
41
-
42
-
43
-
44
-
45
-
46
-
47
-
48
-
49
-
50
-
51
-
52
-
53
-
54
-
55
-
56
-
57
-
58
-
59
-
60
-
61
-
62
-
63
-
64
-
65
-
66
-
67
-
68
-
69
-
70
-
71
-
72
-
73
-
74
-
75
-
76
-
77
-
78
-
79
-
80
-
81
-
82
-
83
-
84
-
85
-
86
-
87
-
88
-
89
-
90
-
91
-
92
-
93
-
94
-
95
-
96
-
97
-
98
-
99
-
100
-
101
-
102
-
103
-
104
-
105
-
106
-
107
-
108
-
109
-
110
-
111
-
112
-
113
-
114
-
115
-
116
-
117
-
118
-
119
-
120
-
121
-
122
-
123
-
124
-
125
-
126
-
127
-
128
-
129
-
130
-
131
-
132
-
133
-
134
-
135
-
136
-
137
-
138
-
139
-
140
-
141
-
142
-
143
-
144
-
145
-
146
-
147
-
148
-
149
-
150
-
151
-
152
-
153
-
154
-
155
-
156
-
 157
157 -
 158
158 -
 159
159 -
 160
160 -
 161
161 -
 162
162 -
 163
163 -
 164
164 -
 165
165 -
 166
166 -
 167
167 -
 168
168 -
 169
169 -
 170
170 -
 171
171 -
 172
172 -
 173
173 -
 174
174 -
 175
175 -
 176
176 -
 177
177 -
178
-
179
-
180
-
181
-
182
-
183
-
184
-
185
-
186
-
187
-
188
-
189
-
190
-
191
-
192
-
193
-
194
-
195
-
196
-
197
-
198
-
199
-
200
-
201
-
202
-
203
-
204
-
205
-
206
-
207
-
208
-
209
-
210
-
211
-
212
-
213
-
214
-
215
-
216
-
217
-
218
-
219
-
220
-
221
-
222
-
223
-
224
-
225
-
226
-
227
-
228
-
229
-
230
-
231
-
232
-
233
-
234
-
235
-
236
-
237
-
238
-
239
-
240
-
241
-
242
-
243
-
244
-
245
-
246
-
247
-
248
-
249
-
250
-
251
-
252
-
253
-
254
-
255
-
256
-
257
-
258
-
259
-
260
-
261
-
262
-
263
-
264
-
265
-
266
-
267
-
268
-
269
-
270
-
271
-
272
-
273
-
274
-
275
-
276
-
277
-
278
-
279
-
280
-
281
-
282
-
283
-
284
-
285
-
286
-
287
-
288
-
289
-
290
-
291
-
292
-
293
-
294
-
295
-
296
-
297
-
298
-
299
-
300
 |
 |

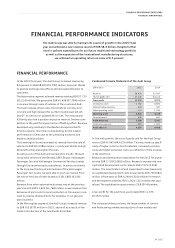
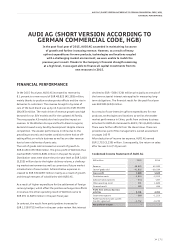
FINANCIAL PERFORMANCE INDICATORS
FINANCIAL PERFORMANCE // NET WORTH
>> 167
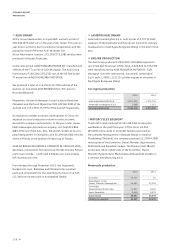
receivables) less non-interest-bearing liabilities (trade paya-
bles and advance payments received). Invested assets aver-
aged EUR 17,467 (15,567) million in the 2015 fiscal year. The
Audi Group achieved an operating profit after tax of EUR 3,385
(3,605) million in 2015. The standardized average tax quota
for the Volkswagen Group of 30 percent was assumed for this
purpose. The reduced return on investment is mainly attributa-
ble to the higher invested assets resulting from the Company’s
current investment phase.
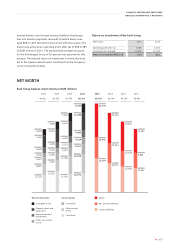
Return on investment of the Audi Group
EUR million 2015 2014
Operating profit after tax 3,385 3,605
Invested assets (average) 17,467 15,567
Return on investment (ROI) in % 19.4 23.2
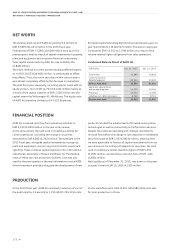
NET WORTH
Audi Group balance sheet structure (EUR million)
Current assets:
Other non-current
assets
Equity-accounted
investments
Property, plant and
equipment
Intangible assets
Non-current assets:
Cash funds
Inventories
Other current
assets
Non-current liabilities
Current liabilities
Equity
2013
45,156
2012
40,401
2014
50,769
2012
40,401
2014
50,769
2013
45,156
18,725
12,844
19,199
16,398
10,194
18,565
9,869
15,092
11,391
11,768
5,071
5,292
11,170
6,855
4,331
4,038
3,551
7,605
13,332
7,387
4,495
4,689
3,163
3,678
4,022
8,413
9,673
15,441
3,638
2,762
2015
56,763
2015
56,763
21,554
13,431
21,779
12,375
12,109
6,317
4,314
4,483
11,380
5,787