Audi 2015 Annual Report Download - page 181
Download and view the complete annual report
Please find page 181 of the 2015 Audi annual report below. You can navigate through the pages in the report by either clicking on the pages listed below, or by using the keyword search tool below to find specific information within the annual report.-
 1
1 -
2
-
3
-
4
-
5
-
6
-
7
-
8
-
9
-
10
-
11
-
12
-
13
-
14
-
15
-
16
-
17
-
18
-
19
-
20
-
21
-
22
-
23
-
24
-
25
-
26
-
27
-
28
-
29
-
30
-
31
-
32
-
33
-
34
-
35
-
36
-
37
-
38
-
39
-
40
-
41
-
42
-
43
-
44
-
45
-
46
-
47
-
48
-
49
-
50
-
51
-
52
-
53
-
54
-
55
-
56
-
57
-
58
-
59
-
60
-
61
-
62
-
63
-
64
-
65
-
66
-
67
-
68
-
69
-
70
-
71
-
72
-
73
-
74
-
75
-
76
-
77
-
78
-
79
-
80
-
81
-
82
-
83
-
84
-
85
-
86
-
87
-
88
-
89
-
90
-
91
-
92
-
93
-
94
-
95
-
96
-
97
-
98
-
99
-
100
-
101
-
102
-
103
-
104
-
105
-
106
-
107
-
108
-
109
-
110
-
111
-
112
-
113
-
114
-
115
-
116
-
117
-
118
-
119
-
120
-
121
-
122
-
123
-
124
-
125
-
126
-
127
-
128
-
129
-
130
-
131
-
132
-
133
-
134
-
135
-
136
-
137
-
138
-
139
-
140
-
141
-
142
-
143
-
144
-
145
-
146
-
147
-
148
-
149
-
150
-
151
-
152
-
153
-
154
-
155
-
156
-
157
-
158
-
159
-
160
-
161
-
162
-
163
-
164
-
165
-
166
-
167
-
168
-
169
-
170
-
 171
171 -
 172
172 -
 173
173 -
 174
174 -
 175
175 -
 176
176 -
 177
177 -
 178
178 -
 179
179 -
 180
180 -
 181
181 -
 182
182 -
 183
183 -
 184
184 -
 185
185 -
 186
186 -
 187
187 -
 188
188 -
 189
189 -
 190
190 -
 191
191 -
192
-
193
-
194
-
195
-
196
-
197
-
198
-
199
-
200
-
201
-
202
-
203
-
204
-
205
-
206
-
207
-
208
-
209
-
210
-
211
-
212
-
213
-
214
-
215
-
216
-
217
-
218
-
219
-
220
-
221
-
222
-
223
-
224
-
225
-
226
-
227
-
228
-
229
-
230
-
231
-
232
-
233
-
234
-
235
-
236
-
237
-
238
-
239
-
240
-
241
-
242
-
243
-
244
-
245
-
246
-
247
-
248
-
249
-
250
-
251
-
252
-
253
-
254
-
255
-
256
-
257
-
258
-
259
-
260
-
261
-
262
-
263
-
264
-
265
-
266
-
267
-
268
-
269
-
270
-
271
-
272
-
273
-
274
-
275
-
276
-
277
-
278
-
279
-
280
-
281
-
282
-
283
-
284
-
285
-
286
-
287
-
288
-
289
-
290
-
291
-
292
-
293
-
294
-
295
-
296
-
297
-
298
-
299
-
300
 |
 |

CORPORATE RESPONSIBILITY
EMPLOYEES
>> 181
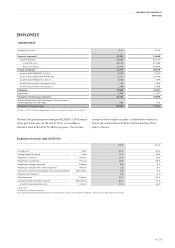
EMPLOYEES
/WORKFORCE
Average for the year 2015 2014
Domestic companies 1) 57,191 53,848
of which AUDI AG 56,058 52,132
Ingolstadt plant 40,724 37,286
Neckarsulm plant 15,334 14,846
Foreign companies 22,775 20,619
of which AUDI BRUSSELS S.A./N.V. 2,520 2,532
of which AUDI HUNGARIA MOTOR Kft. 11,367 10,954
of which AUDI MÉXICO S.A. de C.V. 2,006 879
of which Automobili Lamborghini S.p.A. 1,146 1,058
of which Ducati Motor Holding S.p.A. 1,168 1,088
Employees 79,966 74,467
Apprentices 2,486 2,421
Employees of Audi Group companies 82,452 76,888
Staff employed from other Volkswagen Group companies
not belonging to the Audi Group 386 359
Workforce of the Audi Group 82,838 77,247
1) Of these, 1,159 (1,589) employees were in the passive stage of their partial retirement.
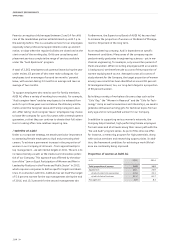
The Audi Group employed an average of 82,838 (77,247) people
in the past fiscal year. At the end of 2015, our workforce
reached a level of 84,435 (79,483) employees. The increase
compared with the previous year is attributable mainly to a
higher personnel total at AUDI AG and the building of the
plant in Mexico.
Employee structural data (AUDI AG)
2015 2014
Average age 1) Years 40.3 40.4
Average length of service Years 16.1 16.6
Proportion of women 1) Percent 14.3 14.0
Proportion of academics 2) Percent 48.0 46.6
Proportion of foreign nationals Percent 8.3 8.3
Proportion of people with severe disabilities Percent 5.8 6.0
Contracts to workshops for people with mental disabilities EUR million 6.8 6.6
Frequency of accidents 3) 3.9 3.1
Attendance rate Percent 96.0 96.3
Savings through Audi Ideas Program EUR million 84.1 67.5
of which implementation rate Percent 57.0 56.9
1) Audi Group
2) Proportion of indirect employees
3) The accident frequency figure indicates how many industrial accidents involving one or more days’ work lost occur per million hours worked.