Audi 2015 Annual Report Download - page 261
Download and view the complete annual report
Please find page 261 of the 2015 Audi annual report below. You can navigate through the pages in the report by either clicking on the pages listed below, or by using the keyword search tool below to find specific information within the annual report.-
 1
1 -
2
-
3
-
4
-
5
-
6
-
7
-
8
-
9
-
10
-
11
-
12
-
13
-
14
-
15
-
16
-
17
-
18
-
19
-
20
-
21
-
22
-
23
-
24
-
25
-
26
-
27
-
28
-
29
-
30
-
31
-
32
-
33
-
34
-
35
-
36
-
37
-
38
-
39
-
40
-
41
-
42
-
43
-
44
-
45
-
46
-
47
-
48
-
49
-
50
-
51
-
52
-
53
-
54
-
55
-
56
-
57
-
58
-
59
-
60
-
61
-
62
-
63
-
64
-
65
-
66
-
67
-
68
-
69
-
70
-
71
-
72
-
73
-
74
-
75
-
76
-
77
-
78
-
79
-
80
-
81
-
82
-
83
-
84
-
85
-
86
-
87
-
88
-
89
-
90
-
91
-
92
-
93
-
94
-
95
-
96
-
97
-
98
-
99
-
100
-
101
-
102
-
103
-
104
-
105
-
106
-
107
-
108
-
109
-
110
-
111
-
112
-
113
-
114
-
115
-
116
-
117
-
118
-
119
-
120
-
121
-
122
-
123
-
124
-
125
-
126
-
127
-
128
-
129
-
130
-
131
-
132
-
133
-
134
-
135
-
136
-
137
-
138
-
139
-
140
-
141
-
142
-
143
-
144
-
145
-
146
-
147
-
148
-
149
-
150
-
151
-
152
-
153
-
154
-
155
-
156
-
157
-
158
-
159
-
160
-
161
-
162
-
163
-
164
-
165
-
166
-
167
-
168
-
169
-
170
-
171
-
172
-
173
-
174
-
175
-
176
-
177
-
178
-
179
-
180
-
181
-
182
-
183
-
184
-
185
-
186
-
187
-
188
-
189
-
190
-
191
-
192
-
193
-
194
-
195
-
196
-
197
-
198
-
199
-
200
-
201
-
202
-
203
-
204
-
205
-
206
-
207
-
208
-
209
-
210
-
211
-
212
-
213
-
214
-
215
-
216
-
217
-
218
-
219
-
220
-
221
-
222
-
223
-
224
-
225
-
226
-
227
-
228
-
229
-
230
-
231
-
232
-
233
-
234
-
235
-
236
-
237
-
238
-
239
-
240
-
241
-
242
-
243
-
244
-
245
-
246
-
247
-
248
-
249
-
250
-
 251
251 -
 252
252 -
 253
253 -
 254
254 -
 255
255 -
 256
256 -
 257
257 -
 258
258 -
 259
259 -
 260
260 -
 261
261 -
 262
262 -
 263
263 -
 264
264 -
 265
265 -
 266
266 -
 267
267 -
 268
268 -
 269
269 -
 270
270 -
 271
271 -
272
-
273
-
274
-
275
-
276
-
277
-
278
-
279
-
280
-
281
-
282
-
283
-
284
-
285
-
286
-
287
-
288
-
289
-
290
-
291
-
292
-
293
-
294
-
295
-
296
-
297
-
298
-
299
-
300
 |
 |

NOTES TO THE CONSOLIDATED FINANCIAL STATEMENTS
ADDITIONAL DISCLOSURES
>> 261
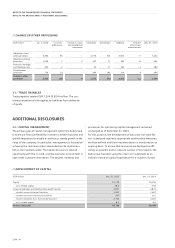
Around 99.55 percent of the subscribed capital is held by
Volkswagen AG, Wolfsburg, with which a control and profit
transfer agreement exists.
In the 2015 fiscal year, equity rose by 13.4 percent compared
with the prior year. This is primarily due to the transfer to
retained earnings and a cash injection to the capital reserve
made by Volkswagen AG.
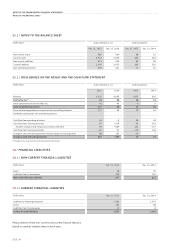
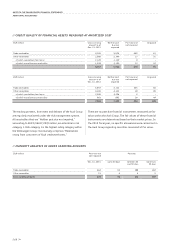
35 / ADDITIONAL DISCLOSURES ON FINANCIAL
INSTRUMENTS IN THE BALANCE SHEET
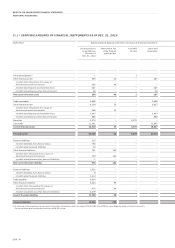
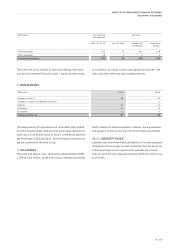
35.1 / FINANCIAL INSTRUMENTS MEASURED AT FAIR
VALUE
Measurement of financial instruments at fair value is based on
a three-level hierarchy and on the proximity of the measurement
factors used to an active market. An active market is one in
which homogeneous products are traded, where willing buyers
and sellers can be found for them at all times, and where their
prices are publicly available.
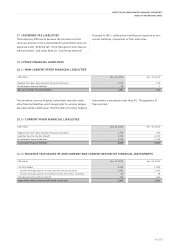
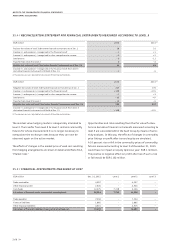
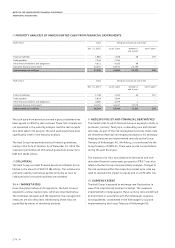
Level 1 of the fair value hierarchy involves the measurement of
financial instruments, such as securities, listed on active markets.
Level 2 involves the measurement of financial instruments
such as derivatives, where the fair value is calculated using
measurement processes based on observable market data.
Particular use is made of exchange rates, interest rates and
commodity prices, which can be observed on the correspond-
ing markets and are acquired via ratings agencies.
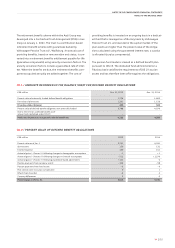
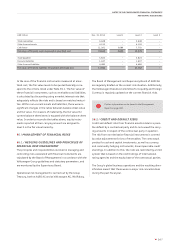
Within the Audi Group, level 3 mainly covers residual value
hedging arrangements with the retail trade. The input factors
for measuring the future development of used car prices can-
not be observed on active markets; they are forecast by various
independent institutions. The residual value hedging model is
explained in Note 36.4, “Market risks.”
Furthermore, non-current commodity futures are also meas-
ured according to level 3, as the long-term nature of the con-
tracts means that the key parameters for their measurement
need to be extrapolated. The extrapolation for the different
commodities is carried out on the basis of observable input
factors, acquired via ratings agencies. Rights to acquire shares
in companies are also assigned to fair value level 3, as there
are no available input factors for measurement derived from
active markets. For the purposes of measuring equity instru-
ments, particular use is made of the respective company plans
and the specific discounting rates.