Audi 2015 Annual Report Download - page 165
Download and view the complete annual report
Please find page 165 of the 2015 Audi annual report below. You can navigate through the pages in the report by either clicking on the pages listed below, or by using the keyword search tool below to find specific information within the annual report.-
 1
1 -
2
-
3
-
4
-
5
-
6
-
7
-
8
-
9
-
10
-
11
-
12
-
13
-
14
-
15
-
16
-
17
-
18
-
19
-
20
-
21
-
22
-
23
-
24
-
25
-
26
-
27
-
28
-
29
-
30
-
31
-
32
-
33
-
34
-
35
-
36
-
37
-
38
-
39
-
40
-
41
-
42
-
43
-
44
-
45
-
46
-
47
-
48
-
49
-
50
-
51
-
52
-
53
-
54
-
55
-
56
-
57
-
58
-
59
-
60
-
61
-
62
-
63
-
64
-
65
-
66
-
67
-
68
-
69
-
70
-
71
-
72
-
73
-
74
-
75
-
76
-
77
-
78
-
79
-
80
-
81
-
82
-
83
-
84
-
85
-
86
-
87
-
88
-
89
-
90
-
91
-
92
-
93
-
94
-
95
-
96
-
97
-
98
-
99
-
100
-
101
-
102
-
103
-
104
-
105
-
106
-
107
-
108
-
109
-
110
-
111
-
112
-
113
-
114
-
115
-
116
-
117
-
118
-
119
-
120
-
121
-
122
-
123
-
124
-
125
-
126
-
127
-
128
-
129
-
130
-
131
-
132
-
133
-
134
-
135
-
136
-
137
-
138
-
139
-
140
-
141
-
142
-
143
-
144
-
145
-
146
-
147
-
148
-
149
-
150
-
151
-
152
-
153
-
154
-
 155
155 -
 156
156 -
 157
157 -
 158
158 -
 159
159 -
 160
160 -
 161
161 -
 162
162 -
 163
163 -
 164
164 -
 165
165 -
 166
166 -
 167
167 -
 168
168 -
 169
169 -
 170
170 -
 171
171 -
 172
172 -
 173
173 -
 174
174 -
 175
175 -
176
-
177
-
178
-
179
-
180
-
181
-
182
-
183
-
184
-
185
-
186
-
187
-
188
-
189
-
190
-
191
-
192
-
193
-
194
-
195
-
196
-
197
-
198
-
199
-
200
-
201
-
202
-
203
-
204
-
205
-
206
-
207
-
208
-
209
-
210
-
211
-
212
-
213
-
214
-
215
-
216
-
217
-
218
-
219
-
220
-
221
-
222
-
223
-
224
-
225
-
226
-
227
-
228
-
229
-
230
-
231
-
232
-
233
-
234
-
235
-
236
-
237
-
238
-
239
-
240
-
241
-
242
-
243
-
244
-
245
-
246
-
247
-
248
-
249
-
250
-
251
-
252
-
253
-
254
-
255
-
256
-
257
-
258
-
259
-
260
-
261
-
262
-
263
-
264
-
265
-
266
-
267
-
268
-
269
-
270
-
271
-
272
-
273
-
274
-
275
-
276
-
277
-
278
-
279
-
280
-
281
-
282
-
283
-
284
-
285
-
286
-
287
-
288
-
289
-
290
-
291
-
292
-
293
-
294
-
295
-
296
-
297
-
298
-
299
-
300
 |
 |

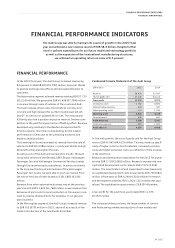
FINANCIAL PERFORMANCE INDICATORS
FINANCIAL PERFORMANCE
>> 165
FINANCIAL PERFORMANCE
In the 2015 fiscal year, the Audi Group increased revenue by
8.6 percent to EUR 58,420 (53,787) million, above all thanks
to positive exchange rate effects and increased deliveries to
customers.
The Automotive segment achieved revenue totaling EUR 57,719
(53,214) million. We generated EUR 41,428 (37,784) million
in revenue through sales of vehicles of the core brand Audi.
The main revenue drivers were the beneficial currency envi-
ronment and high demand for our SUV models Audi Q3, Q5
and Q7, as well as our updated A6 car line. The very popular
A3 family also had a positive impact on revenue. Intense com-
petition in the past fiscal year had an offsetting effect. Revenue
developed very positively in the Western Europe and North
America regions, more than compensating for the weaker
performance in China due to the prevailing economic and
market conditions there.
The Lamborghini brand increased its revenue from the sale of
vehicles to EUR 811 (586) million, in particular thanks to high
demand for the Lamborghini Huracán.
As well as cars of the Audi and Lamborghini brands, the Audi
Group sells vehicles of the Bentley, SEAT, Škoda, Volkswagen
Passenger Cars and Volkswagen Commercial Vehicles brands
through Group-owned sales subsidiaries. In particular thanks
to the increased trading of automobiles of the Volkswagen
Passenger Cars brand, we were able to push up revenue from
the sale of vehicles of other brands to EUR 3,860 (3,076)
million.
Revenue from other automotive business was at the previous
year’s level at EUR 11,620 (11,768) million. Lower revenue from
deliveries of parts sets for local production in China was in con-
trast to positive developments, for example, in our genuine
parts business.
In the Motorcycles segment, the Audi Group increased revenue
to EUR 702 (575) million in 2015, above all as a result of the
market introduction of the new Ducati Scrambler.
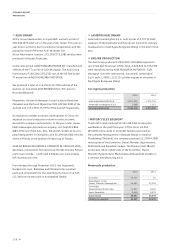
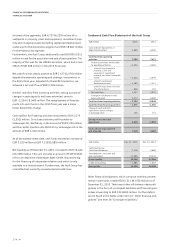
Condensed Income Statement of the Audi Group
EUR million 2015 2014
Revenue 58,420 53,787
Cost of goods sold − 47,043 − 44,415
Gross profit 11,376 9,372
Distribution costs − 5,782 − 4,895
Administrative expenses − 640 − 587
Other operating result − 119 1,260
Operating profit 4,836 5,150
Financial result 448 841
Profit before tax 5,284 5,991
Income tax expense − 987 − 1,563
Profit after tax 4,297 4,428
In line with growth, the cost of goods sold for the Audi Group
rose to EUR 47,043 (44,415) million. This was made up specif-
ically of higher costs for direct materials, increased purchase
costs and higher personnel costs as a reflection of the increase
in the workforce.
Research and development expenditure for the 2015 fiscal year
totaled EUR 3,718 (3,685) million. Research expense and non-
capitalized development costs came to EUR 2,979 (3,005)
million. The amortization of and impairment losses (reversals)
on capitalized development costs amounted to EUR 739 (681)
million. Of the total of EUR 4,240 (4,316) million for research
and development activities, EUR 1,262 (1,311) million was capi-
talized. The capitalization quota came to 29.8 (30.4) percent.
Gross profit for the past fiscal year totaled EUR 11,376
(9,372) million.
The increased delivery volume, the large number of current
and forthcoming market introductions of new models and
FINANCIAL PERFORMANCE INDICATORS
The Audi Group was able to maintain its course of growth in the 2015 fiscal
year and achieved a new revenue record of EUR 58.4 billion. Despite further
rises in upfront expenditures for our future model and technology portfolio
as well as the expansion of the international manufacturing structures,
we achieved an operating return on sales of 8.3 percent.