Audi 2015 Annual Report Download - page 260
Download and view the complete annual report
Please find page 260 of the 2015 Audi annual report below. You can navigate through the pages in the report by either clicking on the pages listed below, or by using the keyword search tool below to find specific information within the annual report.-
 1
1 -
2
-
3
-
4
-
5
-
6
-
7
-
8
-
9
-
10
-
11
-
12
-
13
-
14
-
15
-
16
-
17
-
18
-
19
-
20
-
21
-
22
-
23
-
24
-
25
-
26
-
27
-
28
-
29
-
30
-
31
-
32
-
33
-
34
-
35
-
36
-
37
-
38
-
39
-
40
-
41
-
42
-
43
-
44
-
45
-
46
-
47
-
48
-
49
-
50
-
51
-
52
-
53
-
54
-
55
-
56
-
57
-
58
-
59
-
60
-
61
-
62
-
63
-
64
-
65
-
66
-
67
-
68
-
69
-
70
-
71
-
72
-
73
-
74
-
75
-
76
-
77
-
78
-
79
-
80
-
81
-
82
-
83
-
84
-
85
-
86
-
87
-
88
-
89
-
90
-
91
-
92
-
93
-
94
-
95
-
96
-
97
-
98
-
99
-
100
-
101
-
102
-
103
-
104
-
105
-
106
-
107
-
108
-
109
-
110
-
111
-
112
-
113
-
114
-
115
-
116
-
117
-
118
-
119
-
120
-
121
-
122
-
123
-
124
-
125
-
126
-
127
-
128
-
129
-
130
-
131
-
132
-
133
-
134
-
135
-
136
-
137
-
138
-
139
-
140
-
141
-
142
-
143
-
144
-
145
-
146
-
147
-
148
-
149
-
150
-
151
-
152
-
153
-
154
-
155
-
156
-
157
-
158
-
159
-
160
-
161
-
162
-
163
-
164
-
165
-
166
-
167
-
168
-
169
-
170
-
171
-
172
-
173
-
174
-
175
-
176
-
177
-
178
-
179
-
180
-
181
-
182
-
183
-
184
-
185
-
186
-
187
-
188
-
189
-
190
-
191
-
192
-
193
-
194
-
195
-
196
-
197
-
198
-
199
-
200
-
201
-
202
-
203
-
204
-
205
-
206
-
207
-
208
-
209
-
210
-
211
-
212
-
213
-
214
-
215
-
216
-
217
-
218
-
219
-
220
-
221
-
222
-
223
-
224
-
225
-
226
-
227
-
228
-
229
-
230
-
231
-
232
-
233
-
234
-
235
-
236
-
237
-
238
-
239
-
240
-
241
-
242
-
243
-
244
-
245
-
246
-
247
-
248
-
249
-
 250
250 -
 251
251 -
 252
252 -
 253
253 -
 254
254 -
 255
255 -
 256
256 -
 257
257 -
 258
258 -
 259
259 -
 260
260 -
 261
261 -
 262
262 -
 263
263 -
 264
264 -
 265
265 -
 266
266 -
 267
267 -
 268
268 -
 269
269 -
 270
270 -
271
-
272
-
273
-
274
-
275
-
276
-
277
-
278
-
279
-
280
-
281
-
282
-
283
-
284
-
285
-
286
-
287
-
288
-
289
-
290
-
291
-
292
-
293
-
294
-
295
-
296
-
297
-
298
-
299
-
300
 |
 |

NOTES TO THE CONSOLIDATED FINANCIAL STATEMENTS
NOTES TO THE BALANCE SHEET // ADDITIONAL DISCLOSURES
260 >>
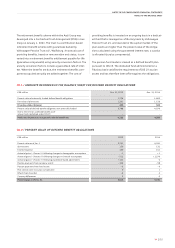
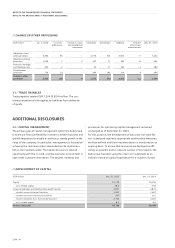
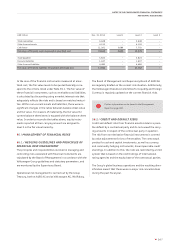
// CHANGE IN OTHER PROVISIONS
EUR million Jan. 1, 2015 Currency-
differences
Change in scope
of consolidated
companies
Utilization Dissolution Addition Interest
effect from
measurement
Dec. 31, 2015
Obligations from
sales operations 6,382 95 –2,076 313 3,362 –7 7,443
Workforce-related
provisions 1,056 2 0167 71 149 –8 961
Provisions for legal
and litigation risks 403 2 –33 17 130 –1 484
Miscellaneous
provisions 759 10 –249 142 314 4 696
Change in other
provisions 8,599 109 02,525 543 3,955 –12 9,584
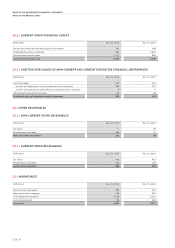
33 / TRADE PAYABLES
Trade payables totaled EUR 7,204 (5,824) million. The cus-
tomary retention of title applies to liabilities from deliveries
of goods.
ADDITIONAL DISCLOSURES
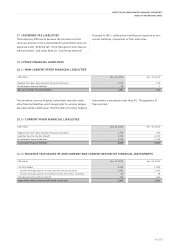
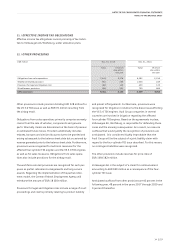
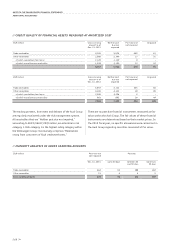
34 / CAPITAL MANAGEMENT
The primary goal of capital management within the Audi Group
is to ensure financial flexibility in order to achieve business and
growth targets and to enable a continuous, steady growth in the
value of the company. In particular, management is focused on
achieving the minimum return demanded by the capital mar-
ket on the invested assets. The capital structure is steered
specifically with this in mind, and the economic environment is
kept under constant observation. The targets, methods and
procedures for optimizing capital management remained
unchanged as of December 31, 2015.
For this purpose, the development of key costs and value fac-
tors is analyzed regularly; appropriate optimization measures
are then defined and their implementation is monitored on an
ongoing basis. To ensure that resources are deployed as effi-
ciently as possible and to measure success in this respect, the
Audi Group has been using the return on investment as an
indicator based on capital expenditure for a number of years.
// DEVELOPMENT OF CAPITAL
EUR million Dec. 31, 2015 Dec. 31, 2014
Equity 21,779 19,199
as % of total capital 38.4 37.8
Financial liabilities and liabilities from profit transfer 4,637 4,876
of which current financial liabilities 1,637 1,422
of which non-current financial liabilities 247 215
of which liabilities from the transfer of profit 2,752 3,239
as % of total capital 8.2 9.6
Balance sheet total 56,763 50,769