Audi 2015 Annual Report Download - page 247
Download and view the complete annual report
Please find page 247 of the 2015 Audi annual report below. You can navigate through the pages in the report by either clicking on the pages listed below, or by using the keyword search tool below to find specific information within the annual report.-
 1
1 -
2
-
3
-
4
-
5
-
6
-
7
-
8
-
9
-
10
-
11
-
12
-
13
-
14
-
15
-
16
-
17
-
18
-
19
-
20
-
21
-
22
-
23
-
24
-
25
-
26
-
27
-
28
-
29
-
30
-
31
-
32
-
33
-
34
-
35
-
36
-
37
-
38
-
39
-
40
-
41
-
42
-
43
-
44
-
45
-
46
-
47
-
48
-
49
-
50
-
51
-
52
-
53
-
54
-
55
-
56
-
57
-
58
-
59
-
60
-
61
-
62
-
63
-
64
-
65
-
66
-
67
-
68
-
69
-
70
-
71
-
72
-
73
-
74
-
75
-
76
-
77
-
78
-
79
-
80
-
81
-
82
-
83
-
84
-
85
-
86
-
87
-
88
-
89
-
90
-
91
-
92
-
93
-
94
-
95
-
96
-
97
-
98
-
99
-
100
-
101
-
102
-
103
-
104
-
105
-
106
-
107
-
108
-
109
-
110
-
111
-
112
-
113
-
114
-
115
-
116
-
117
-
118
-
119
-
120
-
121
-
122
-
123
-
124
-
125
-
126
-
127
-
128
-
129
-
130
-
131
-
132
-
133
-
134
-
135
-
136
-
137
-
138
-
139
-
140
-
141
-
142
-
143
-
144
-
145
-
146
-
147
-
148
-
149
-
150
-
151
-
152
-
153
-
154
-
155
-
156
-
157
-
158
-
159
-
160
-
161
-
162
-
163
-
164
-
165
-
166
-
167
-
168
-
169
-
170
-
171
-
172
-
173
-
174
-
175
-
176
-
177
-
178
-
179
-
180
-
181
-
182
-
183
-
184
-
185
-
186
-
187
-
188
-
189
-
190
-
191
-
192
-
193
-
194
-
195
-
196
-
197
-
198
-
199
-
200
-
201
-
202
-
203
-
204
-
205
-
206
-
207
-
208
-
209
-
210
-
211
-
212
-
213
-
214
-
215
-
216
-
217
-
218
-
219
-
220
-
221
-
222
-
223
-
224
-
225
-
226
-
227
-
228
-
229
-
230
-
231
-
232
-
233
-
234
-
235
-
236
-
 237
237 -
 238
238 -
 239
239 -
 240
240 -
 241
241 -
 242
242 -
 243
243 -
 244
244 -
 245
245 -
 246
246 -
 247
247 -
 248
248 -
 249
249 -
 250
250 -
 251
251 -
 252
252 -
 253
253 -
 254
254 -
 255
255 -
 256
256 -
 257
257 -
258
-
259
-
260
-
261
-
262
-
263
-
264
-
265
-
266
-
267
-
268
-
269
-
270
-
271
-
272
-
273
-
274
-
275
-
276
-
277
-
278
-
279
-
280
-
281
-
282
-
283
-
284
-
285
-
286
-
287
-
288
-
289
-
290
-
291
-
292
-
293
-
294
-
295
-
296
-
297
-
298
-
299
-
300
 |
 |
NOTES TO THE CONSOLIDATED FINANCIAL STATEMENTS
NOTES TO THE BALANCE SHEET
>> 247
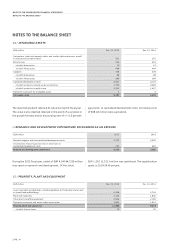
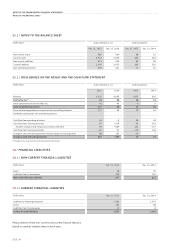
Land and buildings are secured with mortgages totaling EUR
16 (16) million. There is no purchase option with regard to the
land and buildings rented on the basis of a finance lease. The
leases are based on an interest rate of up to 11.3 (3.5) percent
depending on the region.
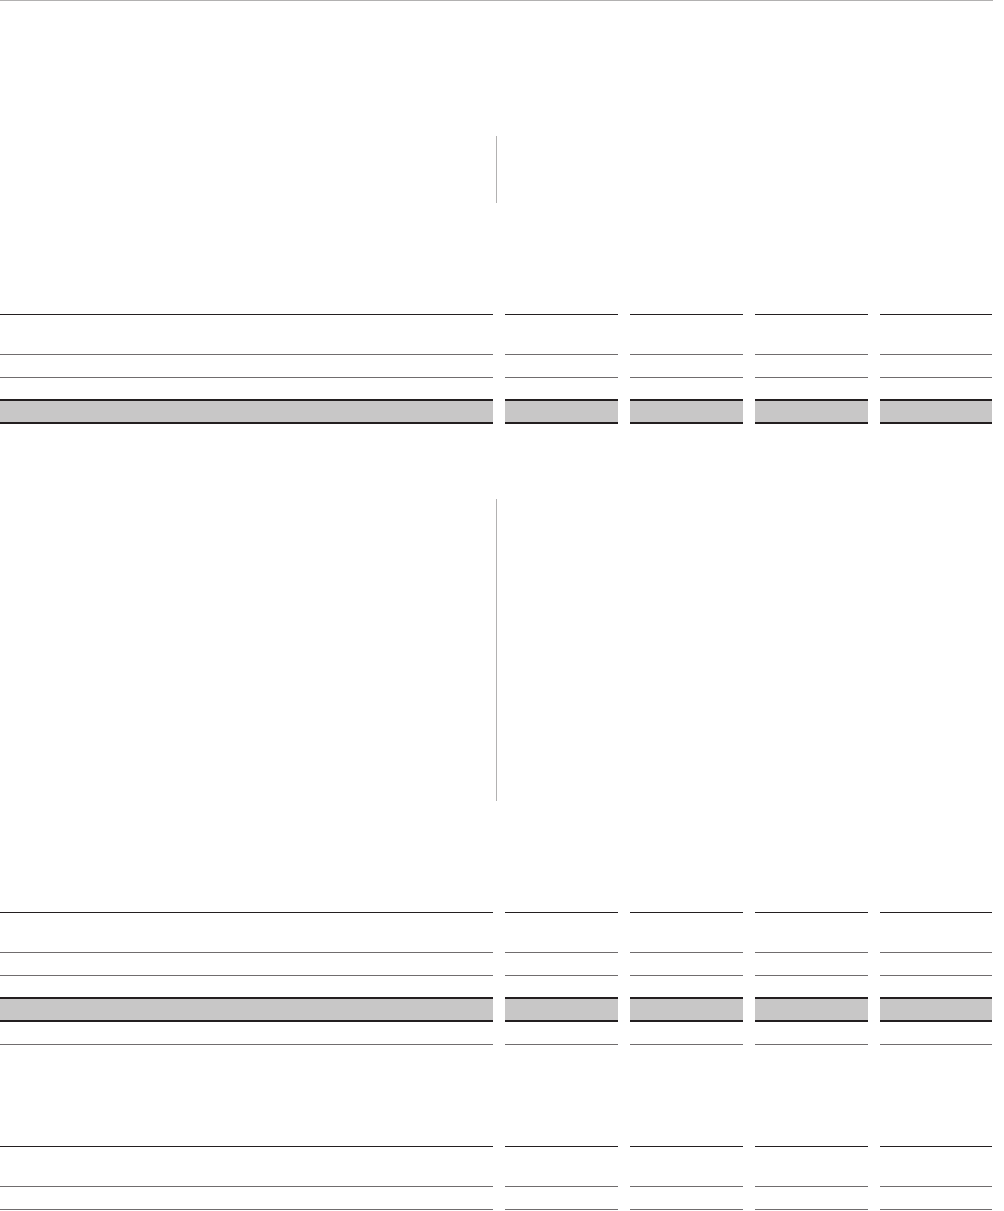
// FINANCE LEASE PAYMENTS DUE IN THE FUTURE
EUR million 2016 2017 to 2020 from 2021 Total
Lease payments 7 31 88 127
Interest elements 1 7 54 61
Present value 7 25 35 66
Payments totaling EUR 191 (155) million for assets rented on
the basis of operate leases were recognized as an expense.
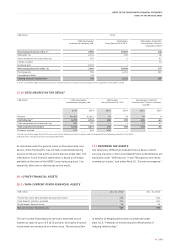
16 / INVESTMENT PROPERTY
In relation to investment property totaling EUR 319 (293)
million, no impairment losses were recorded during the 2015
fiscal year, as was also the case in the previous year. The fair
value of investment property exceeds the amortized costs by
EUR 33 (28) million. Fair values are calculated as a general
rule using a discounted cash flow method and correspond to
level 3 of the fair value hierarchy.
The investment property includes buildings and land with a
value of EUR 167 (175) million rented on the basis of a finance
lease. The leases are based on a maximum interest rate of
4.4 (4.4) percent. The finance lease payments due in future are
listed in the table below together with their present values.
Only low operating costs were incurred in relation to maintain-
ing the investment property, in addition to depreciation and
amortization.
With regard to investment property, future payments in rela-
tion to non-cancelable operate leases are shown in the two
tables below.
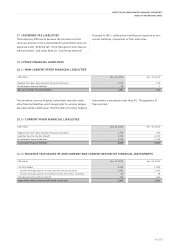
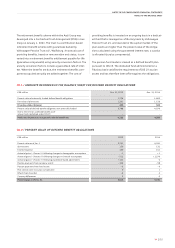
16.1 / FUTURE PAYMENTS IN RELATION TO NON-CANCELABLE FINANCE LEASES
EUR million 2016 2017 to 2020 from 2021 Total
Lease payments 13 38 229 279
Interest elements 7 22 75 103
Present value 6 16 154 176
Payment flows from sub-leasing (operate lease) 12 40 272 323
16.2 / FUTURE PAYMENTS IN RELATION TO NON-CANCELABLE OPERATE LEASES
EUR million 2016 2017 to 2020 from 2021 Total
Lease payments from non-cancelable operate leases 8 28 25 60