Audi 2015 Annual Report Download - page 240
Download and view the complete annual report
Please find page 240 of the 2015 Audi annual report below. You can navigate through the pages in the report by either clicking on the pages listed below, or by using the keyword search tool below to find specific information within the annual report.-
 1
1 -
2
-
3
-
4
-
5
-
6
-
7
-
8
-
9
-
10
-
11
-
12
-
13
-
14
-
15
-
16
-
17
-
18
-
19
-
20
-
21
-
22
-
23
-
24
-
25
-
26
-
27
-
28
-
29
-
30
-
31
-
32
-
33
-
34
-
35
-
36
-
37
-
38
-
39
-
40
-
41
-
42
-
43
-
44
-
45
-
46
-
47
-
48
-
49
-
50
-
51
-
52
-
53
-
54
-
55
-
56
-
57
-
58
-
59
-
60
-
61
-
62
-
63
-
64
-
65
-
66
-
67
-
68
-
69
-
70
-
71
-
72
-
73
-
74
-
75
-
76
-
77
-
78
-
79
-
80
-
81
-
82
-
83
-
84
-
85
-
86
-
87
-
88
-
89
-
90
-
91
-
92
-
93
-
94
-
95
-
96
-
97
-
98
-
99
-
100
-
101
-
102
-
103
-
104
-
105
-
106
-
107
-
108
-
109
-
110
-
111
-
112
-
113
-
114
-
115
-
116
-
117
-
118
-
119
-
120
-
121
-
122
-
123
-
124
-
125
-
126
-
127
-
128
-
129
-
130
-
131
-
132
-
133
-
134
-
135
-
136
-
137
-
138
-
139
-
140
-
141
-
142
-
143
-
144
-
145
-
146
-
147
-
148
-
149
-
150
-
151
-
152
-
153
-
154
-
155
-
156
-
157
-
158
-
159
-
160
-
161
-
162
-
163
-
164
-
165
-
166
-
167
-
168
-
169
-
170
-
171
-
172
-
173
-
174
-
175
-
176
-
177
-
178
-
179
-
180
-
181
-
182
-
183
-
184
-
185
-
186
-
187
-
188
-
189
-
190
-
191
-
192
-
193
-
194
-
195
-
196
-
197
-
198
-
199
-
200
-
201
-
202
-
203
-
204
-
205
-
206
-
207
-
208
-
209
-
210
-
211
-
212
-
213
-
214
-
215
-
216
-
217
-
218
-
219
-
220
-
221
-
222
-
223
-
224
-
225
-
226
-
227
-
228
-
229
-
 230
230 -
 231
231 -
 232
232 -
 233
233 -
 234
234 -
 235
235 -
 236
236 -
 237
237 -
 238
238 -
 239
239 -
 240
240 -
 241
241 -
 242
242 -
 243
243 -
 244
244 -
 245
245 -
 246
246 -
 247
247 -
 248
248 -
 249
249 -
 250
250 -
251
-
252
-
253
-
254
-
255
-
256
-
257
-
258
-
259
-
260
-
261
-
262
-
263
-
264
-
265
-
266
-
267
-
268
-
269
-
270
-
271
-
272
-
273
-
274
-
275
-
276
-
277
-
278
-
279
-
280
-
281
-
282
-
283
-
284
-
285
-
286
-
287
-
288
-
289
-
290
-
291
-
292
-
293
-
294
-
295
-
296
-
297
-
298
-
299
-
300
 |
 |

NOTES TO THE CONSOLIDATED FINANCIAL STATEMENTS
NOTES TO THE INCOME STATEMENT
240 >>
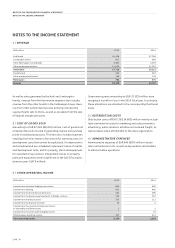
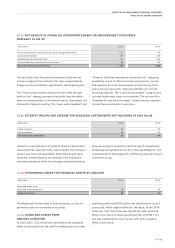
NOTES TO THE INCOME STATEMENT
1 / REVENUE
EUR million 2015 2014
Audi brand 41,428 37,784
Lamborghini brand 811 586
Other Volkswagen Group brands 3,860 3,076
Other automotive business 11,619 11,767
Automotive 57,718 53,213
Ducati brand 563 457
Other motorcycles business 138 118
Motorcycles 702 575
Revenue 58,420 53,787
As well as sales generated by the Audi and Lamborghini
brands, revenue from the Automotive segment also includes
revenue from the other brands in the Volkswagen Group. Reve-
nue from other automotive business primarily includes the
supply of parts sets to China, as well as proceeds from the sale
of engines and genuine parts.
2 / COST OF GOODS SOLD
Amounting to EUR 47,043 (44,415) million, cost of goods sold
comprises the costs incurred in generating revenue and purchase
prices in trading transactions. This item also includes expenses
resulting from the creation of provisions for warranty costs, for
development costs that cannot be capitalized, for depreciation
and scheduled and non-scheduled impairment losses of capital-
ized development costs, and for property, plant and equipment
for manufacturing purposes. Impairment losses on property,
plant and equipment were insignificant in the 2015 fiscal year
(previous year: EUR 5 million).
Government grants amounting to EUR 23 (25) million were
recognized in profit or loss in the 2015 fiscal year. In principle,
these allocations are allocated to the corresponding functional
areas.
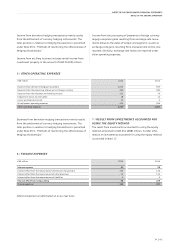
3 / DISTRIBUTION COSTS
Distribution costs of EUR 5,782 (4,895) million mainly include
labor and material costs for marketing and sales promotion,
advertising, public relations activities and outward freight, as
well as depreciation attributable to the sales organization.
4 / ADMINISTRATIVE EXPENSES
Administrative expenses of EUR 640 (587) million include
labor and material costs, as well as depreciation attributable
to administrative operations.
5 / OTHER OPERATING INCOME
EUR million 2015 2014
Income from derivative hedging transactions 806 609
Income from rebilling 591 485
Income from the dissolution of provisions 543 289
Income from the processing of payments in foreign currency 539 297
Income from ancillary business 325 211
Income from the disposal of assets 16 5
Income from the reversal of impairment losses
of receivables and other assets 2 2
Income from the write-up of intangible assets – 20
Miscellaneous operating income 327 411
Other operating income 3,150 2,329