Audi 2015 Annual Report Download - page 141
Download and view the complete annual report
Please find page 141 of the 2015 Audi annual report below. You can navigate through the pages in the report by either clicking on the pages listed below, or by using the keyword search tool below to find specific information within the annual report.-
 1
1 -
2
-
3
-
4
-
5
-
6
-
7
-
8
-
9
-
10
-
11
-
12
-
13
-
14
-
15
-
16
-
17
-
18
-
19
-
20
-
21
-
22
-
23
-
24
-
25
-
26
-
27
-
28
-
29
-
30
-
31
-
32
-
33
-
34
-
35
-
36
-
37
-
38
-
39
-
40
-
41
-
42
-
43
-
44
-
45
-
46
-
47
-
48
-
49
-
50
-
51
-
52
-
53
-
54
-
55
-
56
-
57
-
58
-
59
-
60
-
61
-
62
-
63
-
64
-
65
-
66
-
67
-
68
-
69
-
70
-
71
-
72
-
73
-
74
-
75
-
76
-
77
-
78
-
79
-
80
-
81
-
82
-
83
-
84
-
85
-
86
-
87
-
88
-
89
-
90
-
91
-
92
-
93
-
94
-
95
-
96
-
97
-
98
-
99
-
100
-
101
-
102
-
103
-
104
-
105
-
106
-
107
-
108
-
109
-
110
-
111
-
112
-
113
-
114
-
115
-
116
-
117
-
118
-
119
-
120
-
121
-
122
-
123
-
124
-
125
-
126
-
127
-
128
-
129
-
130
-
 131
131 -
 132
132 -
 133
133 -
 134
134 -
 135
135 -
 136
136 -
 137
137 -
 138
138 -
 139
139 -
 140
140 -
 141
141 -
 142
142 -
 143
143 -
 144
144 -
 145
145 -
 146
146 -
 147
147 -
 148
148 -
 149
149 -
 150
150 -
 151
151 -
152
-
153
-
154
-
155
-
156
-
157
-
158
-
159
-
160
-
161
-
162
-
163
-
164
-
165
-
166
-
167
-
168
-
169
-
170
-
171
-
172
-
173
-
174
-
175
-
176
-
177
-
178
-
179
-
180
-
181
-
182
-
183
-
184
-
185
-
186
-
187
-
188
-
189
-
190
-
191
-
192
-
193
-
194
-
195
-
196
-
197
-
198
-
199
-
200
-
201
-
202
-
203
-
204
-
205
-
206
-
207
-
208
-
209
-
210
-
211
-
212
-
213
-
214
-
215
-
216
-
217
-
218
-
219
-
220
-
221
-
222
-
223
-
224
-
225
-
226
-
227
-
228
-
229
-
230
-
231
-
232
-
233
-
234
-
235
-
236
-
237
-
238
-
239
-
240
-
241
-
242
-
243
-
244
-
245
-
246
-
247
-
248
-
249
-
250
-
251
-
252
-
253
-
254
-
255
-
256
-
257
-
258
-
259
-
260
-
261
-
262
-
263
-
264
-
265
-
266
-
267
-
268
-
269
-
270
-
271
-
272
-
273
-
274
-
275
-
276
-
277
-
278
-
279
-
280
-
281
-
282
-
283
-
284
-
285
-
286
-
287
-
288
-
289
-
290
-
291
-
292
-
293
-
294
-
295
-
296
-
297
-
298
-
299
-
300
 |
 |

BASIS OF THE AUDI GROUP
MANAGEMENT SYSTEM
>> 141
>The long-term sales plan, which highlights market and
segment trends, is the basis for identifying the volume
of deliveries.
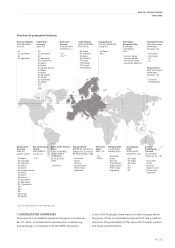
>Planning for the individual production locations is based
on the capacity and utilization plan.
The coordinated results of the upstream planning processes
are fed into the financial medium-term planning. This includes
investment planning as an input for determining future alter-
natives for products and courses of action, financial planning
of the income statement, financial and balance sheet plan-
ning, and also profitability and liquidity planning.
The first year is derived from the medium-term planning and a
budget for operations is drawn up on a month-by-month basis.
The level of budgetary target attainment is tracked and
reviewed each month with the help of various management
tools such as target/actual analyses, year-on-year comparisons
and deviation analyses. Where necessary, action plans are
additionally developed and implemented to back up the budg-
eted objectives. Detailed forecasts are drawn up for the full
year and also for any next three-month period on a rolling
monthly basis. Measures developed to reflect the prevailing
opportunity and risk position are taken into account on an
ongoing basis. The focus of management during the year is
thus on continuously adapting to internal and external chang-
es. At the same time, the current forecast constitutes the basis
for the next medium-term and budget planning.
/KEY PERFORMANCE INDICATORS OF GROUP
MANAGEMENT
The basis for the management of the Audi Group is a value-
oriented corporate management approach in combination with
the following key performance indicators, which have been
derived from the strategic goals:
>Deliveries to customers
>Revenue
>Operating profit/operating return on sales
>Return on investment (ROI)
>Net cash flow
>Ratio of capex
The number of new vehicles delivered to customers is reflected
in the non-financial indicator of deliveries to customers. This
performance indicator reflects demand among customers for
products of the Audi brand and is the relevant variable that we
use to determine our competitive position in the various mar-
kets. An increase in the deliveries to customers indicates high
customer satisfaction and contributes towards attaining the
strategic goal of continuous growth to more than 2 million
Audi vehicles delivered. Growing demand for our products has
a major impact on the development of unit sales and production,
and consequently on the capacity utilization of our locations.
We are only able to handle this growth and the increasing com-
plexity by having motivated and highly qualified employees.
The financial key performance indicators of the Audi Group
include revenue, which is a financial reflection of our market
success. Operating profit is the balance of revenue and resources
deployed, along with the other operating result. It reveals our
fundamental operational activity and the economic performance
of our core business area. The operating return on sales is the
operating profit generated in relation to revenue.
The return on investment (ROI) expresses the return achieved on
the capital employed. We obtain this indicator by determining
the ratio of operating profit after tax to average invested assets.
Net cash flow indicates the cash inflow from operating activi-
ties less cash used in investing activities, not including chang-
es in cash deposits and loans extended. This key performance
indicator serves as a measure of our Company’s level of self-
financing.
The ratio of capex (investments in property, plant and equip-
ment, investment property and other intangible assets, with-
out capitalized development costs) is an indicator of our
Company’s innovative strength. For this purpose, the capex
according to the Cash Flow Statement is considered in relation
to revenue. Capital investment in essence comprises financial
resources for updating and expanding the product range, for
increasing our capacity, as well as for improving the Audi
Group’s production processes.
More information on and explanations of our key
p
erformance indicators can be found under “Deliveries
and distribution” and “Financial performance
indicators” on pages 160 ff. and 165 ff.
You will find further information on non-financial
p
erformance indicators under “Research and devel-
opment,” “Production” and “Corporate responsibility”
on pages 149 ff., 157 ff. and 174 ff.