Audi 2015 Annual Report Download - page 268
Download and view the complete annual report
Please find page 268 of the 2015 Audi annual report below. You can navigate through the pages in the report by either clicking on the pages listed below, or by using the keyword search tool below to find specific information within the annual report.-
 1
1 -
2
-
3
-
4
-
5
-
6
-
7
-
8
-
9
-
10
-
11
-
12
-
13
-
14
-
15
-
16
-
17
-
18
-
19
-
20
-
21
-
22
-
23
-
24
-
25
-
26
-
27
-
28
-
29
-
30
-
31
-
32
-
33
-
34
-
35
-
36
-
37
-
38
-
39
-
40
-
41
-
42
-
43
-
44
-
45
-
46
-
47
-
48
-
49
-
50
-
51
-
52
-
53
-
54
-
55
-
56
-
57
-
58
-
59
-
60
-
61
-
62
-
63
-
64
-
65
-
66
-
67
-
68
-
69
-
70
-
71
-
72
-
73
-
74
-
75
-
76
-
77
-
78
-
79
-
80
-
81
-
82
-
83
-
84
-
85
-
86
-
87
-
88
-
89
-
90
-
91
-
92
-
93
-
94
-
95
-
96
-
97
-
98
-
99
-
100
-
101
-
102
-
103
-
104
-
105
-
106
-
107
-
108
-
109
-
110
-
111
-
112
-
113
-
114
-
115
-
116
-
117
-
118
-
119
-
120
-
121
-
122
-
123
-
124
-
125
-
126
-
127
-
128
-
129
-
130
-
131
-
132
-
133
-
134
-
135
-
136
-
137
-
138
-
139
-
140
-
141
-
142
-
143
-
144
-
145
-
146
-
147
-
148
-
149
-
150
-
151
-
152
-
153
-
154
-
155
-
156
-
157
-
158
-
159
-
160
-
161
-
162
-
163
-
164
-
165
-
166
-
167
-
168
-
169
-
170
-
171
-
172
-
173
-
174
-
175
-
176
-
177
-
178
-
179
-
180
-
181
-
182
-
183
-
184
-
185
-
186
-
187
-
188
-
189
-
190
-
191
-
192
-
193
-
194
-
195
-
196
-
197
-
198
-
199
-
200
-
201
-
202
-
203
-
204
-
205
-
206
-
207
-
208
-
209
-
210
-
211
-
212
-
213
-
214
-
215
-
216
-
217
-
218
-
219
-
220
-
221
-
222
-
223
-
224
-
225
-
226
-
227
-
228
-
229
-
230
-
231
-
232
-
233
-
234
-
235
-
236
-
237
-
238
-
239
-
240
-
241
-
242
-
243
-
244
-
245
-
246
-
247
-
248
-
249
-
250
-
251
-
252
-
253
-
254
-
255
-
256
-
257
-
 258
258 -
 259
259 -
 260
260 -
 261
261 -
 262
262 -
 263
263 -
 264
264 -
 265
265 -
 266
266 -
 267
267 -
 268
268 -
 269
269 -
 270
270 -
 271
271 -
 272
272 -
 273
273 -
 274
274 -
 275
275 -
 276
276 -
 277
277 -
 278
278 -
279
-
280
-
281
-
282
-
283
-
284
-
285
-
286
-
287
-
288
-
289
-
290
-
291
-
292
-
293
-
294
-
295
-
296
-
297
-
298
-
299
-
300
 |
 |

NOTES TO THE CONSOLIDATED FINANCIAL STATEMENTS
ADDITIONAL DISCLOSURES
268 >>
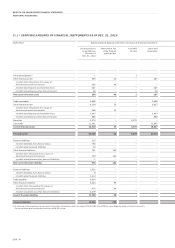
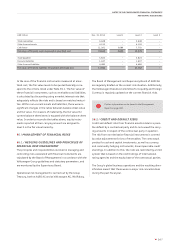
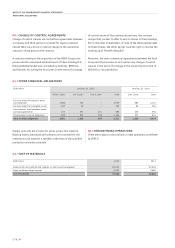
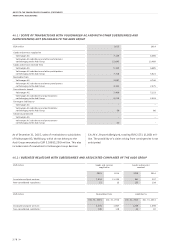
// CREDIT QUALITY OF FINANCIAL ASSETS MEASURED AT AMORTIZED COST
EUR million Gross carrying
amount as of
Dec. 31, 2015
Neither past
due nor
impaired
Past due and
not impaired
Impaired
Trade receivables 4,149 3,626 463 61
Other receivables 2,388 2,340 13 35
of which receivables from loans 1,149 1,149 0 –
of which miscellaneous receivables 1,238 1,190 13 35
6,537 5,966 476 95
EUR million Gross carrying
amount as of
Dec. 31, 2014
Neither past
due nor
impaired
Past due and
not impaired
Impaired
Trade receivables 3,697 3,102 535 60
Other receivables 4,169 4,102 18 49
of which receivables from loans 3,206 3,206 0 –
of which miscellaneous receivables 963 895 18 49
7,866 7,203 554 109
The trading partners, borrowers and debtors of the Audi Group
are regularly monitored under the risk management system.
All receivables that are “Neither past due nor impaired,”
amounting to EUR 5,966 (7,203) million, are allocable to risk
category 1. Risk category 1 is the highest rating category within
the Volkswagen Group; it exclusively comprises “Receivables
owing from customers of high creditworthiness.”
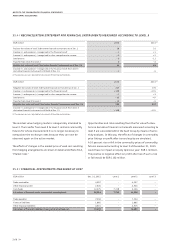
There are no past due financial instruments measured at fair
value within the Audi Group. The fair values of these financial
instruments are determined based on their market prices. In
the 2015 fiscal year, no specific allowances were carried out in
the Audi Group regarding securities measured at fair value.
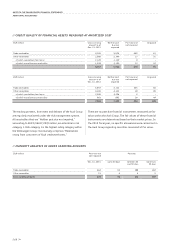
// MATURITY ANALYSIS OF GROSS CARRYING AMOUNTS
EUR million Past due and
not impaired
Past due
Dec. 31, 2015 up to 30 days between 30
and 90 days
more than
90 days
Trade receivables 463 92 188 182
Other receivables 13 4 4 5
Gross carrying amounts 476 96 192 187