AT&T Wireless 2008 Annual Report Download - page 77
Download and view the complete annual report
Please find page 77 of the 2008 AT&T Wireless annual report below. You can navigate through the pages in the report by either clicking on the pages listed below, or by using the keyword search tool below to find specific information within the annual report.-
 1
1 -
2
-
3
-
4
-
5
-
6
-
7
-
8
-
9
-
10
-
11
-
12
-
13
-
14
-
15
-
16
-
17
-
18
-
19
-
20
-
21
-
22
-
23
-
24
-
25
-
26
-
27
-
28
-
29
-
30
-
31
-
32
-
33
-
34
-
35
-
36
-
37
-
38
-
39
-
40
-
41
-
42
-
43
-
44
-
45
-
46
-
47
-
48
-
49
-
50
-
51
-
52
-
53
-
54
-
55
-
56
-
57
-
58
-
59
-
60
-
61
-
62
-
63
-
64
-
65
-
66
-
 67
67 -
 68
68 -
 69
69 -
 70
70 -
 71
71 -
 72
72 -
 73
73 -
 74
74 -
 75
75 -
 76
76 -
 77
77 -
 78
78 -
 79
79 -
 80
80 -
 81
81 -
 82
82 -
 83
83 -
 84
84
 |
 |

AT&T Annual Report 2008
| 75
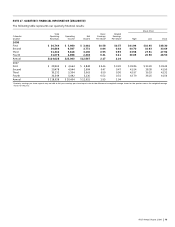
NOTE 17. QUARTERLY FINANCIAL INFORMATION (UNAUDITED)
The following table represents our quarterly financial results:
Stock Price
Total Basic Diluted
Calendar Operating Operating Net Earnings Earnings
Quarter Revenues Income Income Per Share1 Per Share1 High Low Close
2008
First $ 30,744 $ 5,980 $ 3,461 $0.58 $0.57 $41.94 $32.95 $38.30
Second 30,866 6,567 3,772 0.64 0.63 40.70 32.63 33.69
Third 31,342 5,618 3,230 0.55 0.55 33.58 27.51 27.92
Fourth 31,076 4,898 2,404 0.41 0.41 30.65 20.90 28.50
Annual $124,028 $23,063 $12,867 2.17 2.16
2007
First $ 28,969 $ 4,664 $ 2,848 $ 0.46 $ 0.45 $ 39.86 $ 33.20 $ 39.43
Second 29,478 4,944 2,904 0.47 0.47 41.54 38.38 41.50
Third 30,132 5,304 3,063 0.50 0.50 42.97 36.53 42.31
Fourth 30,349 5,492 3,136 0.52 0.51 42.79 36.25 41.56
Annual $ 118,928 $ 20,404 $ 11,951 1.95 1.94
1
Quarterly earnings per share impacts may not add to full-year earnings per share impacts due to the difference in weighted-average shares for the quarters versus the weighted-average
shares for the year.