AT&T Wireless 2008 Annual Report Download - page 71
Download and view the complete annual report
Please find page 71 of the 2008 AT&T Wireless annual report below. You can navigate through the pages in the report by either clicking on the pages listed below, or by using the keyword search tool below to find specific information within the annual report.-
 1
1 -
2
-
3
-
4
-
5
-
6
-
7
-
8
-
9
-
10
-
11
-
12
-
13
-
14
-
15
-
16
-
17
-
18
-
19
-
20
-
21
-
22
-
23
-
24
-
25
-
26
-
27
-
28
-
29
-
30
-
31
-
32
-
33
-
34
-
35
-
36
-
37
-
38
-
39
-
40
-
41
-
42
-
43
-
44
-
45
-
46
-
47
-
48
-
49
-
50
-
51
-
52
-
53
-
54
-
55
-
56
-
57
-
58
-
59
-
60
-
 61
61 -
 62
62 -
 63
63 -
 64
64 -
 65
65 -
 66
66 -
 67
67 -
 68
68 -
 69
69 -
 70
70 -
 71
71 -
 72
72 -
 73
73 -
 74
74 -
 75
75 -
 76
76 -
 77
77 -
 78
78 -
 79
79 -
 80
80 -
 81
81 -
82
-
83
-
84
 |
 |

AT&T Annual Report 2008
| 69
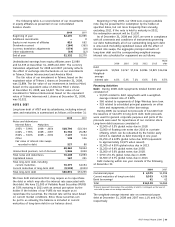
The estimated net loss and prior service cost for pension
benefits that will be amortized from accumulated other
comprehensive income into net periodic benefit cost
over the next fiscal year are $665 and $111, respectively.
The estimated prior service benefit for postretirement
benefits that will be amortized from accumulated other
comprehensive income into net periodic benefit cost over
the next fiscal year is $360.
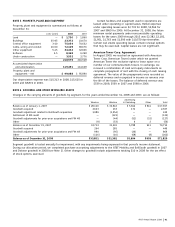
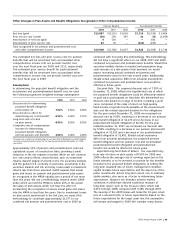
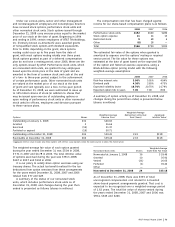
Assumptions
In determining the projected benefit obligation and the
net pension and postemployment benefit cost, we used
the following significant weighted-average assumptions:
2008 2007 2006
Discount rate for determining
projected benefit obligation
at December 31 7.00% 6.50% 6.00%
Discount rate in effect for
determining net cost (benefit)1 6.50% 6.00% 5.75%
Long-term rate of return
on plan assets 8.50% 8.50% 8.50%
Composite rate of compensation
increase for determining
projected benefit obligation
and net pension cost (benefit) 4.00% 4.00% 4.00%
1
Discount rate in effect for determining net cost (benefit) of BellSouth and AT&T Mobility
pension and postretirement plans for the two-day period ended December 31, 2006,
was 6.00%.
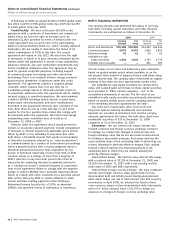
Approximately 10% of pension and postretirement costs are
capitalized as part of construction labor, providing a small
reduction in the net expense recorded. While we will continue
our cost-control efforts, certain factors, such as investment
returns, depend largely on trends in the U.S. securities markets
and the general U.S. economy. In particular, uncertainty in the
securities markets and U.S. economy could result in investment
returns less than those assumed. GAAP requires that actual
gains and losses on pension and postretirement plan assets
be recognized in the MRVA equally over a period of not more
than five years. We use a methodology, allowed under GAAP,
under which we hold the MRVA to within 20% of the actual
fair value of plan assets, which can have the effect of
accelerating the recognition of excess actual gains and losses
into the MRVA to less than five years. Due to investment losses
on plan assets experienced in the last year, we expect this
methodology to contribute approximately $1,577 to our
combined net pension and postretirement cost in 2009 as
compared with not using this methodology. This methodology
did not have a significant effect on our 2008, 2007 and 2006
combined net pension and postretirement benefits. Should the
securities markets decline or medical and prescription drug
costs increase at a rate greater than assumed, we would
expect increasing annual combined net pension and
postretirement costs for the next several years. Additionally,
should actual experience differ from actuarial assumptions,
combined net pension and postretirement cost would be
affected in future years.
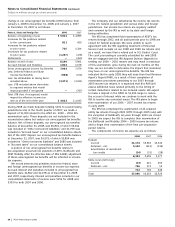
Discount Rate Our assumed discount rate of 7.00% at
December 31, 2008, reflects the hypothetical rate at which
the projected benefit obligations could be effectively settled
or paid out to participants on that date. We determined our
discount rate based on a range of factors, including a yield
curve comprised of the rates of return on high-quality,
fixed-income corporate bonds available at the measurement
date and the related expected duration for the obligations.
For the year ended December 31, 2008, we increased our
discount rate by 0.50%, resulting in a decrease in our pension
plan benefit obligation of $2,176 and a decrease in our
postretirement benefit obligation of $2,154. For the year
ended December 31, 2007, we increased our discount rate
by 0.50%, resulting in a decrease in our pension plan benefit
obligation of $2,353 and a decrease in our postretirement
benefit obligation of $2,492. Should actual experience
differ from actuarial assumptions, the projected pension
benefit obligation and net pension cost and accumulated
postretirement benefit obligation and postretirement
benefit cost would be affected in future years.
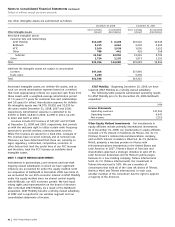
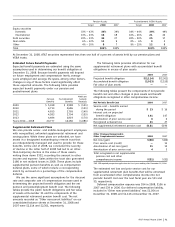
Expected Long-Term Rate of Return Our expected long-
term rate of return on plan assets of 8.50% for 2009 and
2008 reflects the average rate of earnings expected on the
funds invested, or to be invested, to provide for the benefits
included in the projected benefit obligations. In setting the
long-term assumed rate of return, management considers
capital markets future expectations and the asset mix of the
plans’ investments. Actual long-term return can, in relatively
stable markets, also serve as a factor in determining future
expectations. However, the dramatic adverse market
conditions in 2008 have skewed traditional measure of
long-term return, such as the 10-year return, which was
4.21% through 2008, compared with 9.18% through 2007.
The severity of the 2008 losses will make the 10-year return
less of a relevant factor in future expectations. Based on the
future expectations for the target asset mix, this assumption
will remain unchanged for 2009. We consider many factors
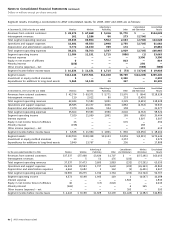
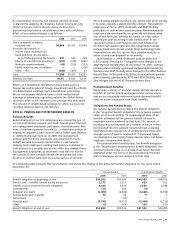
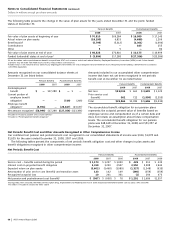
Other Changes in Plan Assets and Benefit Obligations Recognized in Other Comprehensive Income
Pension Benefits Postretirement Benefits
2008 2007 2006 2008 2007 2006
Net loss (gain) $13,857 $(2,131) $2,650 $1,716 $(2,525) $ 3,404
Prior service cost (credit) (16) 139 387 32 (28) (1,655)
Amortization of net loss (gain) 4 154 — — 181 —
Amortization of prior service cost 83 78 — (222) (223) —
Total recognized in net pension and postretirement cost
and other comprehensive income $13,928 $(1,760) $3,037 $1,526 $(2,595) $ 1,749