AT&T Wireless 2008 Annual Report Download - page 33
Download and view the complete annual report
Please find page 33 of the 2008 AT&T Wireless annual report below. You can navigate through the pages in the report by either clicking on the pages listed below, or by using the keyword search tool below to find specific information within the annual report.-
 1
1 -
2
-
3
-
4
-
5
-
6
-
7
-
8
-
9
-
10
-
11
-
12
-
13
-
14
-
15
-
16
-
17
-
18
-
19
-
20
-
21
-
22
-
 23
23 -
 24
24 -
 25
25 -
 26
26 -
 27
27 -
 28
28 -
 29
29 -
 30
30 -
 31
31 -
 32
32 -
 33
33 -
 34
34 -
 35
35 -
 36
36 -
 37
37 -
 38
38 -
 39
39 -
 40
40 -
 41
41 -
 42
42 -
 43
43 -
44
-
45
-
46
-
47
-
48
-
49
-
50
-
51
-
52
-
53
-
54
-
55
-
56
-
57
-
58
-
59
-
60
-
61
-
62
-
63
-
64
-
65
-
66
-
67
-
68
-
69
-
70
-
71
-
72
-
73
-
74
-
75
-
76
-
77
-
78
-
79
-
80
-
81
-
82
-
83
-
84
 |
 |

AT&T Annual Report 2008
| 31
Supplemental Information
Telephone, Wired Broadband and Video Connections Summary Our switched access lines and other services provided by
our local exchange telephone subsidiaries at December 31, 2008, 2007 and 2006 are shown below and trends are addressed
throughout this segment discussion.
Percent Change
Pro Forma 2008 vs. 2007 vs.
(in 000s) 2008 2007 20067 2007 2006
Switched Access Lines1
Retail Consumer 30,614 35,009 37,073 (12.6)% (5.6)%
Retail Business2 21,826 22,811 23,484 (4.3) (2.9)
Retail Subtotal2 52,440 57,820 60,557 (9.3) (4.5)
Percent of total switched access lines 94.3% 93.9% 91.1%
Sold to ATTC2 140 181 1,294 (22.7) (86.0)
Sold to other CLECs2,3 2,912 3,330 4,288 (12.6) (22.3)
Wholesale Subtotal2 3,052 3,511 5,582 (13.1) (37.1)
Percent of total switched access lines 5.5% 5.7% 8.4%
Payphone (Retail and Wholesale)4 118 251 330 (53.0) (23.9)
Percent of total switched access lines 0.2% 0.4% 0.5%
Total Switched Access Lines 55,610 61,582 66,469 (9.7) (7.4)
Total Wired Broadband Connections2,5 15,077 14,156 12,170 6.5 16.3
Satellite service6 2,190 2,116 1,507 3.5 40.4
U-verse video 1,045 231 3 — —
Video Connections 3,235 2,347 1,510 37.8% 55.4%
1 Represents access lines served by AT&T’s ILECs and affiliates.
2 Prior period amounts restated to conform to current period reporting methodology.
3 Competitive local exchange carriers (CLECs).
4 Revenue from retail payphone lines is reported in the Other segment. We are in the process of ending our retail payphone operations.
5 Total wired broadband connections include DSL, U-verse high-speed Internet access and satellite broadband.
6 Satellite service includes connections under our agency and resale agreements.
7 Amounts shown include BellSouth’s access lines in service after the December 29, 2006 BellSouth acquisition.
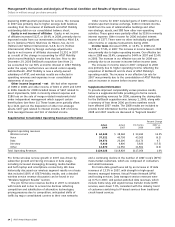
In addition to the impact of the BellSouth acquisition,
selling, general and administrative expenses in 2007 increased
due to the following:
• Salaryandwagemeritincreasesandotherbonus
accruals of $102.
• Higherexpensesof$96in2007duetoa2006change
in our policy regarding the timing for earning vacation
days, which reduced expense in 2006.
• Higherprovisionforuncollectibleaccountsof$80.
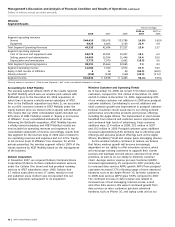
Partially offsetting these increases, selling, general and
administrative expenses in 2007 decreased due to:
• Lowernetpensionandpostretirementcostof$243,
primarily due to changes in our actuarial assumptions,
including the increase of our discount rate from 5.75% to
6.00% (a decrease to expense) and favorable investment
returns on plan assets resulting in a decrease in the
recognition of net losses from prior years.
• Loweremployeelevels,whichdecreasedexpenses,
primarily salary and wages, by $222.
• Lowernonemployee-relatedexpenses,suchascontract
services, agent commissions and materials and supplies
costs, of $148.
Depreciation and amortization expenses decreased $266,
or 2%, in 2008. We had an increase of $3,734, or 38.6%, in
2007 primarily due to higher depreciable and amortizable
asset bases as a result of the acquisition of BellSouth in 2006.
The relative stability in 2008 is a result of decreasing
intangible amortization partially offsetting increased
depreciation resulting from capital additions.