AT&T Wireless 2008 Annual Report Download - page 70
Download and view the complete annual report
Please find page 70 of the 2008 AT&T Wireless annual report below. You can navigate through the pages in the report by either clicking on the pages listed below, or by using the keyword search tool below to find specific information within the annual report.-
 1
1 -
2
-
3
-
4
-
5
-
6
-
7
-
8
-
9
-
10
-
11
-
12
-
13
-
14
-
15
-
16
-
17
-
18
-
19
-
20
-
21
-
22
-
23
-
24
-
25
-
26
-
27
-
28
-
29
-
30
-
31
-
32
-
33
-
34
-
35
-
36
-
37
-
38
-
39
-
40
-
41
-
42
-
43
-
44
-
45
-
46
-
47
-
48
-
49
-
50
-
51
-
52
-
53
-
54
-
55
-
56
-
57
-
58
-
59
-
 60
60 -
 61
61 -
 62
62 -
 63
63 -
 64
64 -
 65
65 -
 66
66 -
 67
67 -
 68
68 -
 69
69 -
 70
70 -
 71
71 -
 72
72 -
 73
73 -
 74
74 -
 75
75 -
 76
76 -
 77
77 -
 78
78 -
 79
79 -
 80
80 -
81
-
82
-
83
-
84
 |
 |

Notes to Consolidated Financial Statements (continued)
Dollars in millions except per share amounts
68
| AT&T Annual Report 2008
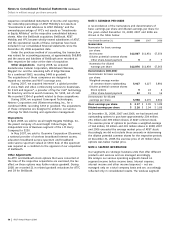
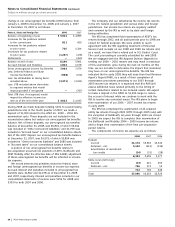
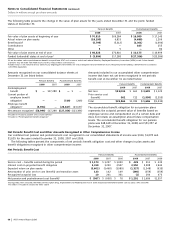
The following table presents the change in the value of plan assets for the years ended December 31 and the plans’ funded
status at December 31:
Pension Benefits Postretirement Benefits
2008 2007 2008 2007
Fair value of plan assets at beginning of year $ 70,810 $69,284 $ 16,999 $ 17,145
Actual return on plan assets (18,190) 6,833 (4,688) 1,209
Benefits paid1 (5,795) (5,312) (2,301) (1,694)
Contributions — — 165 255
Other 3 5 — 84
Fair value of plan assets at end of year $ 46,828 $70,810 $ 10,175 $ 16,999
Funded (unfunded) status at end of year2 $ (3,994) $17,288 $(27,356) $(23,386)
1 At our discretion, certain postretirement benefits are paid from AT&T cash accounts and do not reduce Voluntary Employee Beneficiary Association (VEBA) assets. Future benefit
payments may be made from VEBA trusts and thus reduce those asset balances.
2 Funded status is not indicative of our ability to pay ongoing pension benefits nor of our obligation to fund retirement trusts. Required pension funding is determined in accordance
with ERISA regulations.
Amounts recognized on our consolidated balance sheets at
December 31 are listed below:
Pension Benefits Postretirement Benefits
2008 2007 2008 2007
Postemployment
benefit $ — $17,288 $ — $ —
Current portion of
employee benefit
obligation1 — — (729) (249)
Employee benefit
obligation2 (3,994) — (26,627) (23,137)
Net amount recognized $(3,994) $17,288 $(27,356) $(23,386)
1Included in “Accounts payable and accrued liabilities.”
2Included in “Postemployment benefit obligation.”
Amounts included in our accumulated other comprehensive
income that have not yet been recognized in net periodic
benefit cost at December 31 are listed below:
Pension Benefits Postretirement Benefits
2008 2007 2008 2007
Net loss $23,004 $ 661 $ 3,695 $ 1,125
Prior service cost
(benefit) 562 722 (1,999) (2,355)
Total $23,566 $1,383 $ 1,696 $(1,230)
The accumulated benefit obligation for our pension plans
represents the actuarial present value of benefits based on
employee service and compensation as of a certain date and
does not include an assumption about future compensation
levels. The accumulated benefit obligation for our pension
plans was $48,618 at December 31, 2008, and $51,357 at
December 31, 2007.
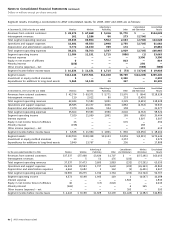
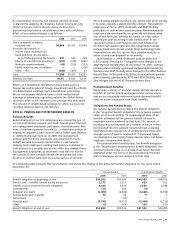
Net Periodic Benefit Cost and Other Amounts Recognized in Other Comprehensive Income
Our combined net pension and postretirement cost recognized in our consolidated statements of income was $324, $1,078 and
$1,635 for the years ended December 31, 2008, 2007 and 2006.
The following tables present the components of net periodic benefit obligation cost and other changes in plan assets and
benefit obligations recognized in other comprehensive income:
Net Periodic Benefit Cost
Pension Benefits Postretirement Benefits
2008 2007 2006 2008 2007 2006
Service cost – benefits earned during the period $ 1,173 $ 1,257 $ 1,050 $ 429 $ 511 $ 435
Interest cost on projected benefit obligation 3,319 3,220 2,507 2,550 2,588 1,943
Expected return on plan assets (5,602) (5,468) (3,989) (1,327) (1,348) (935)
Amortization of prior service cost (benefit) and transition asset 133 142 149 (360) (359) (359)
Recognized actuarial loss 10 241 361 (1) 294 473
Net pension and postretirement cost (benefit)1 $ (967) $ (608) $ 78 $ 1,291 $ 1,686 $1,557
1 During 2008, 2007 and 2006, the Medicare Prescription Drug, Improvement and Modernization Act of 2003 reduced postretirement benefit cost by $263, $342 and $349.
This effect is included in several line items above.